CASE STUDY CONCEPT: The central challenge of most supply chains is to meet product demand (be responsive), while also reducing inventory and operating costs (be efficient). You will learn about this challenge as the supply chain manager for a company called “Cincinnati Seasonings” in Cincinnati, Ohio USA.
The company reflects the heritage of this historic river city. The company’s founder learned about food seasonings and spices by working in the family business while growing up. That business is a chain of restaurants whose specialty is Cincinnati-style chili, the city’s contribution to world cuisine. It uses a certain fine mix of seasonings to give it the flavor it is famous for (Wikipedia, “Cincinnati Chili” – http://en.wikipedia.org/wiki/Cincinnati_chili).

Demand for Cincinnati Seasonings products is growing steadily, and you have been hired to run the company’s supply chain operations. There is a seasonings factory downtown in an industrial area by the river, and a distribution center (DC) at a transportation hub on the outskirts of town. From the DC, products are delivered to stores in Ohio and surrounding states. The company wants you to improve their existing supply chain, and then expand it to support the company’s growth as they open new stores.
[This is the case study to start with. After going through the 6 steps to getting started, do this case study. Work individually at first, not in groups. Each person needs their own account. Read the introduction to Cincinnati Seasonings, and take on the three challenges shown below. That’s how you’ll learn to use the software, and how to use simulations to analyze and design supply chains. Then you will be ready to work in groups or work on more advanced cases. For instructors there is a step-by-step study guide for this case. Instructors can request an evaluation account and a copy of the study guide.]
NOTE: Translate this online guide into any language with the Google Chrome browser. Right-click on any page in this guide to open the Chrome browser options window. Click on “Translate to…”. Google Translate window opens in upper right corner of the screen — click on the three dots and choose a language.
The Cincinnati Seasonings Supply Chain
Cincinnati Seasonings has a relatively simple supply chain composed of one factory, one warehouse distribution center (DC), and three stores. This supply chain enables the company to sell its products in stores around the Midwestern United States. As the case study progresses, you will be challenged to keep expanding the supply chain to serve more stores farther and farther away from the original company factory and DC.

[ We offer an advanced version of this case as a multiplayer game. See “A Multiplayer Supply Chain Game – Overview” for more details.]
In working with this case study you will get experience dealing with one of the central challenges of supply chain management: Always meet customer demand (be responsive) while also keeping operating costs and inventory levels as low as possible (be efficient). You need to make sure there is always enough products at the stores to meet customer demand, and while you do this, you also need to reduce expenses as much as possible so the company can earn a profit.

You will get an introduction to the five supply chain drivers as shown in this diagram (see more in our blog article Five Supply Chain Drivers). With this case you will see how decisions made about the five drivers affect your overall supply chain performance (its responsiveness and its efficiency). You cannot think only of efficiency, or only of responsiveness. You have to find a good balance between the two. And that balance keeps changing as situations change.
In working with Cincinnati Seasonings you will become familiar with the basics of setting up a supply chain and managing its daily operations. You will create and modify the facilities, vehicles and routes as needed to respond to different challenges. Then you’ll run simulations that show how well your supply chain works. Based on what the simulations show, keep improving your design to get the best performance you can. In this process, you will gain an appreciation for some of the key issues involved in operating any supply chain.
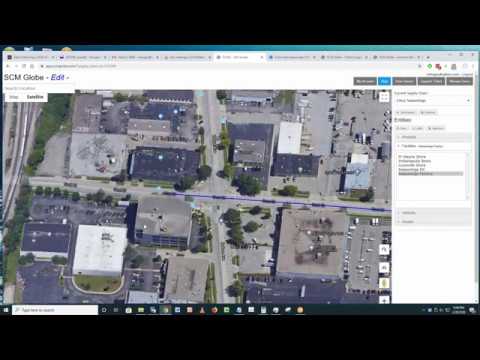
Go to the online library and import a copy of the Cincinnati Seasonings supply chain model into your account. Then open the model in your edit screen (shown below). You see the seasonings factory and the company distribution center, and you also see the routes connecting these facilities and the three stores that sell the company’s product. 
Zoom in on the map and look at the facilities and routes more closely. Switch from the map view to the satellite view (button in upper left corner of screen) to get an even better picture of what this supply chain looks like. See where individual facilities are located.

Even though Cincinnati Seasons is not a real company, the model of this supply chain is highly realistic. This is because facilities are placed where they really could be, the vehicles used to move products between facilities act the same way real vehicles would act, and they follow real delivery routes. This is explained further in the video clip below.
Four Supply Chain Entities Define This Supply Chain
When you load the Cincinnati Seasonings supply chain in the Edit screen you see the supply chain drawn on a map. What you see is the model of the supply chain; it is created by combinations of the four supply chain entities: 1) products; 2) facilities; vehicles; and routes.
Click on the “Products” tab in the sidebar menu on the right side of the screen. You see a product called “Spicy Cube” in the products menu. Click on this product and a dialog box opens up with information about the product. It is a mix of different seasonings and spices the company makes. It is shipped in a standard pallet-size container that is one cubic meter in volume and 40 kilograms in weight. It has a price of $1,000
Click on the “Facilities” tab and click on some of the facilities. A dialog box opens up to display information about those facilities. In this supply chain most of the vehicles are stationed at the DC to support a “hub and spoke” distribution model (the DC is the central hub and the delivery routes are the spokes). So when you click on the Seasonings DC, the blue route lines for the vehicles stationed at that facility appear on the map. Whenever you see blue lines appear after clicking on a facility, you know one or more vehicles are based at that facility.
Then click on the “Vehicles” menu tab to see the vehicles assigned to that facility. As you click on each vehicle, the route traveled by that vehicle is shown on the map. When you select a vehicle, you can click on the “Routes” menu and select a route. This opens a dialog box to show you information about that route.

[ Save time and avoid confusion by taking 15 – 30 minutes to scan through the 6 steps for Getting Started and the Frequently Asked Questions (FAQs).]
Now you know something about how the company’s supply chain is designed, so let’s see how well it works. Click on the “Simulation” button in the upper right corner of the edit screen, and a new browser tab opens to show the simulation screen. Wait for the supply chain to draw on the map, then click the “Play” button to start the simulation. The simulation begins.
As the simulation plays out, the SCM Globe simulation engine calculates and displays the results of the actions and interactions happening with the supply chain entities shown above. You see vehicles moving on their routes, and on the right side of the screen you see graphic and numeric displays of data generated by the simulation. They show what is happening at each facility, and show information about the vehicles and products in the supply chain.
At the end of day two a problem occurs at the Ft Wayne store… Your first supply chain challenge has appeared.
[NOTE: When editing or simulating supply chains in SCM Globe you can always access this Online Guide by clicking the blue “Help” button in the upper right corner of any SCM Globe application screen.]
FIRST CHALLENGE
Get this supply chain to run for 30 days (one month)
As the new supply chain manager for Cincinnati Seasonings you have inherited a mess. You need to make improvements to the supply chain to get it to run for 30 days. You are going to encounter a few problems early on that will cause the supply chain to crash. Either too much product builds up at one facility and you run out of storage space, or you run out of product at another facility and can’t meet customer demand.
To fix these problems you have many options. You can take actions such as:
- increase or decrease storage capacity at facilities
- increase or decrease product delivery amounts (drop qty) on delivery routes
- change delivery vehicles and types
- change delivery routes
- change delivery frequencies (delay between departures)
There are many combinations of these actions you can try. Some combinations work better than others. In the Edit screen, select the entities you want to change and type in new numbers for those entities (remember to click the “Update” button after making changes). Try out different ideas, and run simulations to see the results of different ideas.
Do whatever seems best to get the supply chain to run for 30+ days. Try things. Simulations show what works, and you will find a way to get to 30+ days. If you get a simulation that runs well past 30 days, you can click the “Stop” button in the upper right corner of the simulation screen to stop the simulation.

At Cincinnati Seasonings they use a 30-day S&OP cycle (sales and operations planning cycle). That is why you focus on 30-day, or one month simulations. Every month, the company updates its product demand forecasts at the stores and that leads to changes in its production schedule at the factory. Which in turn leads to changes in vehicles and delivery routes. So there isn’t much point in running simulations beyond 30 days. Your job is to plan and manage supply chain operations from one monthly S&OP cycle to the next. Your goal is to meet product demand each month at all the stores (be responsive) while also reducing inventory and operating costs as much as possible (be efficient).
The supply chain model you create and get to run for 30 days is also the monthly operating plan for your supply chain. It shows how much product will be made at the factory, and how much product will be delivered to each facility. And it shows the vehicles and routes used to make those deliveries. Simulations show how well that plan will work. Using simulation results, you make changes to your supply chain model (operating plan) so as to achieve better levels of performance.
Getting Started with Cincinnati Seasonings
You can scan the video below for ideas on how to start working with the Cincinnati Seasonings supply chain simulation. And in the Getting Started section Step 5 “Working with Case Studies” also shows ideas for how to work with this or any other case study.

SAVE BACKUP COPIES of your supply chain model from time to time as you make changes. There is no “undo”, but if a change doesn’t work out, you can restore from a saved copy. And sometimes supply chain model files (json files) become damaged and no longer work, so you want backup copies of your supply chain to restore from when that happens.
[NOTE: When editing or simulating supply chains in SCM Globe you can always access this Online Guide by clicking the blue “Help” button in the upper right corner of any SCM Globe application screen.]
A Few Things You Should Not Do
SCM Globe is used to model and simulate real supply chains so all numbers in any model can be changed as needed to more accurately describe actual products, facilities, vehicles and routes. However, when using the simulations as a learning tool it does not make sense to change some default values even though the software will let you do so. You should not change certain default values listed below because it either doesn’t make business sense, or it doesn’t make logistics sense (see further explanation in the email a logistics professor sent to his students — Case Study Caveats and Taboos):
- Don’t reduce product demand or prices – that makes no business sense as business is about increasing demand and profits.
- Don’t increase or decrease initial on-hand inventory amounts at the start of a case study – that makes no logistics sense as inventory doesn’t simply appear or disappear.
- Don’t change default values for daily rent and operating costs at facilities, or default values for vehicle operating costs. Unless your instructor says otherwise, you can assume they are out of your control in this case study.
- NOTE: Rent costs at facilities are set higher than current market rates. If your instructor does allow you to change rent costs, use a commercial real-estate website such as CityFeet (www.cityfeet.com) to research current rental rates in different cities and type in those rental rates in place of the default rates.
Apart from these few things, you can do lots of things to address challenges and solve problems that arise. You can try different combinations of things such as:
- Add or change types and numbers of delivery vehicles
- Add, change, or delete delivery routes
- Change delivery frequencies (delay between departures)
- Change delivery amounts (drop qty)
- Expand or reduce storage capacity at facilities
- Adjust production rates at the factory
- Experiment with different locations for new facilities added during the case study
- You can do anything not specifically prohibited!
This case study is not a multiple choice test. There is no single “right answer” — only better answers. Running simulations and downloading the results to create Profit & Loss Reports will show you the better answers. They are the ones that keep the supply chain running for 30 days at lower operating costs and lower inventory levels — they make the supply chain as responsive and efficient as possible.
SECOND CHALLENGE
Extend this supply chain by adding two more stores, and keep it running for 30 days
As soon as you stabilize the company supply chain and get it to run for 30 days, they want you to add more stores and delivery routes to support expansion of the business. The business needs to open new stores and increase sales in order to cover monthly rent and operating costs and show a profit.
Click on “Facilities” and then click on the “New” button to create new facilities in cities where Cincinnati Seasonings is opening new stores. Create stores in the following two cities using the numbers shown below:
- Chicago Store: daily demand 100; quantity on-hand 300; storage capacity 500
- Columbus Store: daily demand 30; quantity on-hand 60; storage capacity 300
The VP Sales tells you the address for the new Chicago Store is: 1840 N Clybourn Ave, Chicago IL. As shown in the screenshot below, you type that address into the location finder in the upper left corner of the edit screen (1). The map zooms in on the location specified. You pull back a bit to get a sense of the surrounding area and switch to the satellite view by clicking on the Map/Satellite button in upper left corner of the screen (2).

In the satellite view you zoom in again to take a closer look at the building where the new store will be located (red circle). You assess the loading facilities at the building and make some decisions about the size of trucks the facility can handle. Then you open the Facilities menu tab and click the “New” button to add this new store (3). And you click on “Product” in the facility dialog box to add products to the store (4).
Regarding the Columbus store, it will be in the northwest side of the Columbus, Ohio metro area near the intersection of the I-270 expressway and Rt 33 (as shown in screenshot below), but no specific address is known yet. So just place the store in that general area. Zoom in on that area of the map and switch to the satellite view. Look for a shopping mall in that area or some other likely spot for the store and place it there. You can always come back later and edit the facility to change its location by dragging and dropping it to a different location if needed.

After you create the Chicago and Columbus stores, select the Seasonings DC facility and create Vehicles and Routes to deliver the Spicy Cube to these new stores. Things to think about as you do this are: frequency of deliveries; size of trucks to use; and delivery routes for the trucks.
Unless your instructor tells you otherwise, just accept the default specifications for the trucks you create. The default speed is 90 kilometers per hour (about 55 mph) and the carry volumes and weights vary according to the size of truck (small, medium, or large). You can also try using other vehicles such as trains, or airplanes, or even ships on the Ohio River if you want. Simulations show how well different kinds of vehicles and routes will work.
You can control the frequency of deliveries a vehicle makes by setting the number in the “Delay between departures” field. If you set the number to 24 then the vehicle will depart again 24 hours after it returns from its last delivery run; if you set the number to 8 then the vehicle will depart 8 hours after returning from its last delivery run. If the delay between departures for a vehicle is currently 20 hours and you want it to run twice as often then cut the delay in half and make it 10 hours. If you want it to run four times a often then make the delay 5 hours, etc.
When you create a delivery vehicle, then create one or more delivery routes for it. You can create routes that take a vehicle back and forth between the DC and a particular store where it drops off all the products it carries. Or you can create routes that take a vehicle from the DC to two or more stores where it drops off at each store some portion of the total products it is carrying. When you are finished creating new vehicles and routes, delete any vehicles that do not have routes assigned to them.
HINT: Try whatever vehicle and route combinations look best — then run simulations and see what happens. Experiment with different ideas. There are no right answers, only better answers. And better answers are those that keep the supply chain running for 30 days while also lowering operating costs and inventory levels. Remember that as you make changes and additions to your supply chain model, the Butterfly Effect will cause your simulation results to differ somewhat from others who are working on the same case study.
As the company continues to grow, you can add even more stores after you get Chicago and Columbus up and running. Your instructor may suggest adding new stores in cities such as:
- Kansas City: store demand 75; on-hand 300; storage 500
- St. Louis: store demand 50; on-hand 250; storage 400
- Buenos Aires, London, Montreal, Paris, or Singapore… how will you deliver products to these cities?
- Create stores in these cities and define vehicles and routes to keep them efficiently supplied with products
SAVE BACKUP COPIES of your supply chain model from time to time as you make changes. There is no “undo”, but if a change doesn’t work out, you can restore from a saved copy. And sometimes supply chain model files (json files) become damaged and they no longer work, so you want backup copies of your supply chain to restore from when that happens.
THIRD CHALLENGE
Lower transportation and operating costs, and reduce on-hand inventory, while still keeping the extended supply chain running for 30 days. Then download your simulation data and generate a Monthly Profit & Loss report. How much profit can you make?
Now that you have created a responsive supply chain to support company growth, you need to improve its efficiency to support company profitability. You need to keep your supply chain running for 30 days while also finding ways to lower transportation costs, facility operating costs, and the amounts of on-hand inventory across the supply chain. Balancing these two demands is the central challenge of supply chain management!
You will find you cannot just focus on lowering one cost without considering its impact on other costs. And you will find the overall performance of the supply chain is dependent on an ever shifting mix of interactions between the four supply chain entities (products, facilities, vehicles, and routes). You can learn more about how to analyze simulation data in the online guide section “Analyzing Simulation Data“.

Generate Monthly Profit & Loss Reports
The screenshots above show a sample of the data displays you get when you run simulations. Use these onscreen data displays and keep modifying your supply chain model so as to improve overall performance and get your simulation to run for 30 days. Then when you have 30+ days of simulation data you can download your simulation data to a spreadsheet to further analyze the numbers and fine tune your supply chain performance. You will see how supply chain operations impact company profitability.
As you add new stores you also increase revenue. As revenue rises, and if you can control costs, you begin to make a profit. Can you design a supply chain model that shows a profit after adding the new stores in Chicago and Columbus? How many new stores do you need to add before you can show a profit in your monthly P&L report?
THERE IS A SPREADSHEET REPORTING TEMPLATE
You can download a copy of the Monthly P&L reporting template and use it to generate reports. When you run your simulation and get it to run for 30+ days, you can download the simulation data and import that data into the reporting template to produce monthly Profit & Loss (P&L) Reports plus key performance indicators (KPIs). This report shows both the financial and operational sides of supply chain management. An example is shown below.

P&L reports help you analyze your supply chain performance and find areas for improvement that will increase overall supply chain efficiency and profitability. You can also track the carbon footprint of your supply chain. To learn how to generate a P&L report from simulation data go to Analyzing Simulation Data and scroll down to “Exporting Simulation Data” and “Download Simulation Data to Spreadsheet Reporting Templates“.
[If you are using SCM Globe Professional version, these reports can be generated automatically by clicking on the “Generate P&L Report” button on the Simulate Screen]
NOTE: Default values that come with the Cincinnati Seasonings supply chain model require you to cut costs AND increase revenue (open more stores) in order to make the company profitable. With only three stores you can reduce losses, but you cannot simply cut and save your way to profitability. However, as you add new stores and the revenue they generate, you will find ways to be profitable. Good supply chain management enables companies to expand and increase their revenues as well as control their operating costs.
Look for ways to make your delivery scheduling and delivery amounts more closely match customer demand. Look for ways to carry less inventory at the stores thereby saving on storage and rent costs. Balance the cost of transportation against the cost of storage space when you set on-hand inventory targets at facilities. Look for ways to match production of spices with store demand, and create a smooth flow of products from the factory to the DC and out to the stores.
Send In Your Best Solution
Once you have obtained your best simulation results and downloaded the simulation data into your P&L reporting template, save your supply chain model. In the Edit screen click on Options > Create Save State (upper right corner of the screen). The file saved will have the latest time stamp.
In your Account Management screen, click on “Download Save State” to download your supply chain model to your computer, and rename the file as <yourname>.json where <yourname> is your first and last name. Attach this .json file and the spreadsheet with your P&L Report to an email, and send them to your course instructor (see further instructions in “Download and Share Supply Chain Models“).
Your best solution should have a P&L report generated from your simulation data that shows the company is making a profit from the operation of its five stores. There are many ways to do this, and some ways generate bigger profits than others. All you need to do is show one way that produces a profit (large or small).
YOU MAY FIND SOLUTIONS NOBODY ELSE HAS THOUGHT OF
Apply supply chain concepts and best practices from your readings and lectures to solve the problems you encounter in this case study. The problem-solving skills you develop here are directly applicable to the real world. Techniques that work well in these simulations will also work well to improve actual supply chain operations (see our blog article Four Reasons to Use Simulations in Supply Chain Learning).
Sometimes traditional ideas work best. And sometimes you need to think out of the box. Try things and see what happens. Simulations show how well your ideas will work. Use simulations to find that mix of traditional and out of the box ideas that deliver the performance you want.
It may feel a bit awkward at first… like learning the steps to a new dance. But after a little practice it will click; you’ll get it. It might even be fun 🙂 . “You’ll start to see the patterns and move to the rhythms of supply chain management.” That’s how one professor described it in a note to his students — “What You Learn from Case Studies and Simulations“.

[ Instructors interested in this case can request an evaluation account and a copy of the study guide.]
You will acquire an intuitive or “street-smart” sense (a mental model) for how supply chains operate. And you will develop analytical skills for looking at the data, and exploring different ideas to improve supply chain performance.
In discussing simulation results with your instructor and classmates, you’ll find yourself using supply chain terminology and concepts you learned in readings and lectures to describe the problems you encounter and the actions you take to fix them. You will start talking and thinking like a real supply chain professional. After you finish these three challenges, you can go further with Cincinnati Seasonings, or move on to other case studies in the library. You can also start modeling real supply chains, and designing new ones.
NOTE: Going On to More Advanced Cases and Simulations
Please look in the online guide for more advanced modeling and simulation techniques to employ as you need them. Check the Table of Contents on the upper right side of screens in this online guide for links to other sections of interest. Some useful sections in the guide are: “Tips for Building Supply Chain Models“; and “Cutting Inventory and Operating Costs“.
Remember…
- Get Spreadsheet Reporting Templates — You can download your simulation data and use it to produce monthly Profit & Loss Reports plus key performance indicators (KPIs) that measure your supply chain performance. Go to Analyzing Simulation Data and scroll down to “Download Simulation Data to Spreadsheet Reporting Templates“.
- If You Are Using SCM Globe Professional — reports can be generated automatically by clicking on the “Generate P&L Report” button on the Simulate Screen
- Share Your Supply Chain Model — See “Download and Share Supply Chain Models” to download a copy of your supply chain (json file) to your PC and send it to other SCM Globe users
Register on SCM Globe to gain access to this and other supply chain simulations. Click the blue “Register” button on the app login page, and buy an account with a credit card (unless you already have an account). Scan the “Getting Started” section, and you are ready to start. Go to the SCM Globe library and click the “Import” button next to this or any other supply chain model.