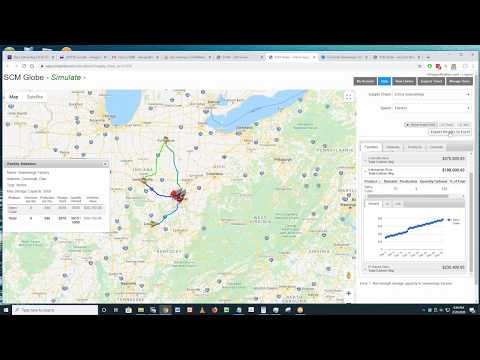
When you click the “Play” button on the Simulate screen the SCM Globe simulation engine takes your supply chain model and runs it. The simulation engine calculates moment by moment how your supply chain will perform. You see vehicles moving on their delivery routes, and you see graphic and numeric displays of operating data on the right side of the screen. Let’s look at some of this data and see how to use it to improve supply chain operations.
NOTE: For a full discussion of available simulation data and how to use it, please read the online guide section Supply Chain Modeling and Simulation Logic.
As you run simulations you see displays of data such as cost of operations for each facility and amounts of inventory on-hand in the data display windows on the right side of the screen. You see the names of your facilities and to the right of each facility name is its accumulated operating cost shown in bold numbers. In addition to facilities data, you can click on the other tabs in the data display to see data on vehicles, products, and the simulation console. Samples of the data available in these tabs are shown below.
[ To access this Online Guide — click “Help” button in upper right of any SCM Globe application screen]
SIDEBAR DATA DISPLAYS

(click image for larger picture)
Shown above from left to right are examples of: the Facilities tab; the Vehicles tab; the Products tab; and the Console tab.
In the “Facilities” tab you see the facility name, its accumulated opeating cost, amount of products on-hand, and a graphic display of products on-hand day by day
When you click on the “Vehicles” tab you see the names of the vehicles, cumulative total operating costs, cumulative carbon output, destination and name of route.
On the “Products” tab you will see facility names, product names, on-hand amounts and value of on-hand amounts.
Click on the “Console” tab to get a daily breakout of this data for each facility and product.
NOTE ABOUT DATA DISPLAYS: Simulation data shown onscreen is HOURLY, and simulation data downloaded is DAILY (24 hour totals). Also, data displayed in the inventory on-hand graphs on the Simulate screen are DAILY data.
The simulation engine calculates supply chain performance on an hour by hour basis. Hourly numeric data is displayed in the onscreen numeric displays as it is calculated. But for onscreen graphic displays this hourly data is aggregated into 24 hour totals and displayed as daily results. The simulation data displayed in the console and downloaded at the end of a simulation contains data that is aggregated into 24 hour totals. This means you will not see every number you see in onscreen numeric displays in the downloaded simulation data.
You can download all of this data to a spreadsheet for further analysis. Click the button in the upper right corner labeled “Export Results to Excel“. This export button appears whenever the simulation stops because of a supply chain error or when you press the “Stop” button (also in upper right corner). See more about this below in “Exporting Simulation Data” and “Download Simulation Data to Spreadsheet Reporting Template”.
SEE THE BIG PICTURE – AND ANALYZE THE DETAILS
SCM Globe uses a map-based user interface to provide a clear geographic context for you to understand the simulation results and not get lost in the details. The goal is for you to see the detailed simulation data within the big-picture context provided by the map of your supply chain (see more about user interface design here – User Interface for SCM Globe).
As you run simulations of your supply chain you see how inventory moves through the different facilities. You see where too much inventory builds up and where it runs out. You see where facilities need more storage capacity and where they can do with less. You see how transportation costs vary depending on how often you make deliveries and what kinds of vehicles you use. Click on the display tabs for the different facilities and vehicles to see graphic and numeric presentations of the simulation data.
The game of supply chain management is about combining analytic skills with intuitive big picture understanding – also known as “street smarts”. When playing the game of supply chain management, the best players develop and combine their analytic skills and their street smarts.
SOME THINGS TO KEEP IN MIND
When you look at the on-hand inventory graphs for different facilities watch for a few simple yet critical characteristics:

- Downward sloping lines mean not enough product is delivered to meet demand
- Upward sloping lines mean more product is being delivered or manufactured than is needed to meet demand at that facility
- Saw tooth patterns indicate deliveries happening every few days — on-hand product gets drawn down by daily demand and then spikes up when deliveries are made
- Stair step patterns indicate occasional missed deliveries that eat into safety stock (downward sloping stair step), or occasional extra deliveries that add too much to safety stock (upward sloping stair step) — see more about this in Deliveries Do Not Always Work Perfectly
- A flat line or relatively flat line means product delivery is matched with demand – that’s what you want to see, the flatter the line the better (like the yellow line in the display on the right side above). Try to flatten out the on-hand product trend lines as much as possible at each facility. Then move that line (and the inventory level it represents) down as far as possible so as to minimize on-hand inventory. That lowest level is the safety stock level – it equals enough product on-hand to cover demand on those days when product delivery is missed.
Try to synchronize production with overall demand. Total up daily demand at all the stores that are supported by a factory. Then set factory production levels to meet that demand and not exceed demand. If you move productions levels up or down, you can adjust operating costs up or down accordingly using your best estimates (or just leave the default costs in place if you wish). Learn more about reducing inventory and operating costs in the section “Cutting Inventory and Operating Costs“.
Click on the products tab to see where inventory is building up in the supply chain. The big numbers jump out quickly.
Click on the vehicles tab to see running costs of vehicle operations. The big numbers jump out quickly.
** Occasionally you will see something that doesn’t seem right… A delivery is missed; or two deliveries are made instead of one; or your simulation results are slightly different from those of other classmates. Welcome to the Butterfly Effect! This effect is used to introduce an element of randomness and unpredictability into the simulations. Just as supply chains do not always operate perfectly in the real world, supply chains do not always operate perfectly in the simulations either. This is explained in the online guide section All Supply Chain Models are Approximations.
Use these on-screen data displays to get a big picture view of the overall supply chain. Avoid diving into detailed data analysis until you have first experimented with different actions based on your visual analysis of trends. Be creative.
REMEMBER: Keep browser tabs open for the EDIT screen and SIMULATE screen and for this ONLINE GUIDE as shown in the illustration below.

As you work with the simulations there will be two tabs open in your web browser; one tab with the Edit screen, and another tab with the Simulate screen. Flip back and forth between browser tabs as needed. Look at data from running your simulation on the Simulate tab, and make changes to your supply chain model on the Edit tab. After making changes to the supply chain model in the Edit screen, go to the Simulate screen and click the “Reload Supply Chain” button or click the browser refresh button before running the simulation again in order include the changes you just made.
Analyze onscreen data displays to find problems and improve your supply chain performance. Do what you feel is best to get your supply chain simulation to run for 30+ days. Then download the simulation data to a spreadsheet and do some detailed analysis on particular facilities, vehicles and routes to fine tune your design and achieve even better results.
EXPORT SIMULATION DATA TO YOUR COMPUTER
When your simulation stops because it found a problem, or because you clicked on the “Stop” button, a new button will appear on the Simulate screen.
It is labeled “Export Results to Excel” as shown in the screenshot below, red arrow #1. Click on this button and it will export the simulation data as a comma separated values (CSV) file to your computer as shown by red arrow #2 (see FAQs question #1 if you use the Firefox browser).

(click on image for larger picture)
The data is downloaded as a CSV (comma separated values) file so it can be opened by any spreadsheet – Apple Numbers, Google Sheets, Microsoft Excel, etc. If you are using the Firefox web browser there are a few more steps to opening the downloaded simulation data, see an explanation in the answer to FAQ 1 in the FAQs section of this guide.
This short video demonstrates what the screenshots and instructions above describe:

Once the simulation data is open in your spreadsheet, you can view the downloaded data. It is grouped into sections. There are data sections for:
- On-Hand report – product on-hand by facility by day
- Demand report – product demand by facility by day
- Production report – products produced by facility by day
- In report – products coming in by facility by day (numbers are cumulative)
- Out report – products going out by facility by day (numbers are cumulative)
- Facilities Cost report – storage space rent plus operating cost by facility by day (costs are cumulative)
- Vehicles Cost report – cumulative cost of operations by vehicle, plus cumulative carbon generated by vehicle
Vehicle cost data has both a variable cost and a fixed cost component. The variable cost is vehicle operating cost per km times the number of kms a vehicle travels each day. The fixed cost component is added at the start of a simulation and accounts for things such as maintenance, insurance, lease payments etc. This fixed cost component is explained in “Tips for Building Supply Chain Models” Scroll down to the header “Day 0 Calculations and Adjustments”
Use this data to calculate financial reports and supply chain performance indicators. If the exact data you want is not provided by the simulation, then look for ways to calculate or estimate that data from what is available. Here are just a few examples; you can probably think of others:
- Assume product demand at facilities defined as stores represents units sold. Multiply the number of units demanded at retail facilities by the prices of those products and add in the retail markup used by the stores (see example in reporting template below) to get a good estimate of sales revenue supported by a supply chain.
- Cost of raw materials or component parts used in a factory or other facility can be estimated by the amount of those products that come into the facility. Multiply the amount of those products that came in by their product price.
- Simulation data for products coming in and going out of facilities are cumulative, and so are daily facility operating expenses. So get daily numbers by subtracting the previous day’s numbers from the current day’s numbers.
- Facility costs include both rent expense and operating expense, and the simulation data is cumulative. Get the daily cost for a facility by dividing the total cumulative operating cost for a facility by the number of days in the simulation period.
- Vehicle cost and carbon numbers are also cumulative, to get average daily vehicle costs you can divide the total cumulative cost for a vehicle by the number of days in the simulation period.
IMPORT SIMULATION DATA INTO SPREADSHEET REPORTING TEMPLATE
As you run your simulation, remember 30 days of data are needed for a monthly report, so click the “Stop” button after the simulation runs a few days past 30. The “Export Results to Excel” button will appear. Click that button, and see the simulation data download to your computer as a CSV file. Once the data is downloaded, open up that CSV file with whatever spreadsheet application you are using.
The screenshots below show a process that will work regardless of the computer you are using (Apple, Android, Chrome, Windows), or the type of spreadsheet you are using (Apple Numbers, Google Sheets, Windows Excel, etc.). We assume you have a basic understanding of what a spreadsheet is and how it works. Each brand of spreadsheet has slightly different commands to accomplish the same basic functions, yet all spreadsheets perform the same basic functions (the functions shown here are all basic spreadsheet functions).
Using whatever spreadsheet you choose, open the downloaded CSV file. Shown below is an example from a CSV file produced by a simulation of the initial Cincinnati Seasonings supply chain after it has run for 33 days. It shows several days of extra data beyond 30 days (highlighted and about to be deleted). Trim the extra rows in the other sections of downloaded data as well. Leave just one blank row in the spreadsheet between the end of one data section and the name of the next data section.
Do not just highlight rows and press the delete key as that will only delete the data but not the actual rows in the spreadsheet. For instance, when using the Microsoft Excel spreadsheet, click the “Home” button in the spreadsheet command menu at the top of the screen, then click “Delete” and “Delete Sheet Rows” to delete the highlighted rows from the spreadsheet.

NOTE: The simulation data for vehicle costs is a single cumulative number for each vehicle. If your simulation ran only a few days past 30 days you can just accept the downloaded vehicle costs as they are. To get a more precise number for vehicle costs you can divide vehicle costs by the number of days you ran your simulation. Then multiply the resulting daily vehicle costs by 30 to get the exact 30 day total cost for each vehicle.
Once you trim all the simulation data sections to 30 days, you can copy the trimmed data and paste it into a monthly Profit & Loss Report template that you also download to your computer. This monthly reporting template is a spreadsheet with one tab for simulation data and another tab with the equations that read the simulation data and produce the P&L report and key performance indicators (KPIs).
This short video explains what the screenshots and instructions above describe:
DOWNLOAD 5-STORE CINCINNATI SEASONINGS P&L REPORTING TEMPLATE — includes the Seasonings Factory, Seasonings DC, and five stores. The stores are: Louisville; Indianapolis; Ft Wayne; Chicago; and Columbus. Use this template after you have added new stores in Chicago and Columbus.
Download 3-Store Monthly P&L Reporting Template — set up for a factory, a DC, and three stores as shown in the beginning model for the Cincinnati Seasonings case. In the Cincinnati Seasonings case study it is very hard to show a profit with revenue from only three stores (although a few people have found ways to do so). Usually, more stores are needed to generate more revenue and cover supply chain costs before you can show a profit.
NOTE: Download a copy of the spreadsheet reporting template to your computer, then you can work with it on your computer. You cannot work with or change the master copy of the reporting template online.
[If you are using SCM Globe Professional version, mission reports can be generated automatically by clicking on the “Generate P&L Report” button on the Simulate Screen]
Now open the spreadsheet with your trimmed simulation data, and open the downloaded spreadsheet with the P&L reporting template. Follow these four steps:
- Click on cell A1 in upper left corner of the spreadsheet with your trimmed simulation data; select all data (Ctrl-A); and copy that data (Ctrl-C).
- At the bottom of the downloaded P&L reporting template click the tab labeled “Simulation Data” as shown in the screenshot below.
- On the Simulation Data worksheet of the reporting template, click on cell A1 in upper left corner of the spreadsheet; then insert (Ctrl-V) the data you just copied from the spreadsheet with the trimmed simulation data.
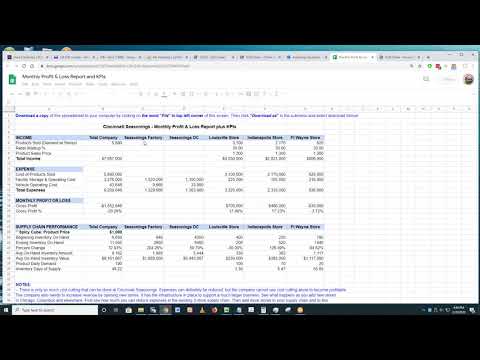
- Click the tab labeled “P&L Report and KPIs” at the bottom of the reporting template. The simulation data you just inserted will be used to calculate a new P&L Report and KPIs such as shown below.

EXPLANATION OF THIS REPORTING TEMPLATE – this template is set up to work with the initial Cincinnati Seasonings model. Look at cells in the spreadsheet template and see how equations in the reporting tab read data in the simulation data tab. See section below on how to modify this reporting template as needed to cover additional facilities you may add to your Cincinnati Seasonings supply chain model. See section at bottom of this page for links to other available reporting templates. You can also create your own reporting templates as needed. Use the techniques you see in these templates to create reporting templates for other supply chain models you may create.
These reports identify facilities that are not performing well and operations that need improvement. For instance, we can see right away the Ft Wayne Store has problems. It is has negative gross profits. When you look at the supply chain performance numbers you see more about the Ft Wayne operation; its on-hand inventory rises sharply during the month, and the inventory days of supply are larger than they need to be. This is also true for several other facilities. And because of these problems, you can see the gross profit for the total company is negative. That needs to change. And see if you can find ways to lower the vehicle carbon footprint too.
By analyzing these reports you can see what changes you need to make to the facilities, vehicles and routes in the supply chain model that created this simulation data. Make those changes, run a simulation, and download the simulation data again. Trim the data and copy it into your reporting spreadsheet again and see if it produces the improvements you are looking for.
Download data from different simulations into this spreadsheet and create reports to show the results from different simulations of your supply chain model. The P&L reports and KPIs are examples of what can be done. You can think of other reports and performance ratios that can be calculated from the downloaded data.
NOTE: Default values that come with the Cincinnati Seasonings supply chain model require you to both cut costs and increase revenue (open more stores) in order to make the company profitable. You cannot just cut and save your way to profitability with the initial supply chain model. You will find ways to be profitable after you add new stores. Supply chains enable companies to expand and increase their revenue as well as control their operating costs.
** IF YOU PURCHASED the BUSINESS EDITION: SCM GLOBE PRO — This version automatically generates P&L Reports and Mission Reports. Please contact us (info@scmglobe.com) to activate the data import/export, and advanced modeling and reporting features of SCM GLOBE PRO. Academic customers get a 50% discount on the price of SCM GLOBE PRO.
REPORTING TEMPLATES AVAILABLE FOR DOWNLOAD
In addition to monthly P&L Reports for commercial businesses, there are also templates for Humanitarian/Military Mission Reports, and a beta test Supply Chain Optimizing Report. Click on the links below to download copies of those reporting templates.
1. THREE-STORE P&L REPORTING TEMPLATE (Single Product) — set up for a factory, a DC, and three stores as shown in the beginning model for the Cincinnati Seasonings case study. Download a copy and modify as needed.
2. FIVE-STORE P&L REPORTING TEMPLATE (Single Product) — set up for a factory, a DC, and five stores as shown in second and third challenges of the Cincinnati Seasonings case. Download a copy and modify as needed.
3. SIX-STORE P&L REPORTING TEMPLATE (Single Product with Inventory Holding Cost) — set up for a factory, a DC, and six stores as shown in the Hyderabadi Biryani case study. Download a copy and modify as needed.
4. THREE-STORE P&L REPORTING TEMPLATE – MULTIPLE PRODUCTS — set up for S&J Trading Company and three products. Download a copy to your computer and add more products and facilities as needed.
5. HUMANITARIAN / MILITARY MISSION REPORTING TEMPLATE – MULTIPLE PRODUCTS — There is a mission reporting template for humanitarian and military supply chains (i.e. non-profit oriented supply chains). It has an operations report and a performance dashboard for analyzing simulation data. The template is built for a 15-day period and you can import your simulation data after trimming it for 15 days. The operations report shows facility and product detail, and the dashboard shows where the best opportunities are for improvement. Download a copy and modify as needed.
6. CASE STUDY SPECIFIC REPORTING TEMPLATES — examples of the above templates modified as needed to fit specific case studies:
- Cincinnati Seasonings (3 Stores)
- Cincinnati Seasonings (5 Stores)
- Hyderabadi Biryani P&L Reporting with Inventory Holding Cost
- Zara Clothing Company P&L Reporting Template
- S&J Trading Company – Angola P&L
- Blue Ocean Co-op Local and Sustainable P&L
- Supply Chains of the Roman Empire P&L
- Ancient Silk Road – Merchant House of Barmikid P&L
- Nepal Earthquake Disaster Response Mission Report Ver 1
- Disaster Response Mission Report Ver 2
- Syria Evacuation Scenario (MIL)
- Alexander the Great Afghan Supply Chain
- Battle of Smolensk – Army Group Center
7. SUPPLY CHAIN OPTIMIZING & REPORTING TEMPLATE — this template contains all the features of the original P&L reporting template plus more features for optimizing supply chain designs:
- EOQ equation to calculate best product delivery amounts and frequencies
- Supply chain Performance Dashboard to monitor performance in areas of Inventory, Transportation and Storage
- Facility Detail reporting provides more insight into operations at individual facilities and pinpoints the biggest opportunities for improvement
For more explanation of these new features, and to get a copy of the optimizing and reporting template, see Supply Chain Optimization & Reporting Template.
CONTRIBUTOR: This supply chain optimizing template was contributed by Robert Scanlon, management consultant and adjunct professor (scanlonro
MODIFY P&L REPORTING TEMPLATE TO ADD NEW FACILITIES – A SHORT TUTORIAL
This short tutorial is a quick introduction to modifying a basic reporting template to fit your supply chain model as it grows and changes. You can add new facilities by adding more columns for each new facility. And you can add more products by adding more rows for each new product. You can also add your own formulas to this template to read simulation data and calculate other financial numbers or KPIs not presently provided. The basic templates we provide can be modified to fit any supply chain model you create.
Here’s how to add new stores to a P&L reporting template. Click on any of the screenshots below to see larger images. The screenshots below show a process that will work regardless of the computer you are using (Apple, Android, Chrome, Windows), or the type of spreadsheet you are using (Apple Numbers, Google Sheets, Windows Excel, etc.). We assume you have a basic understanding of what a spreadsheet is and how it works. Each brand of spreadsheet has slightly different commands to accomplish the same functions, but all spreadsheets perform the same functions. The functions shown below are all basic spreadsheet functions.
First, you add the new facilities into your supply chain model and get your model to run in simulations for 30+ days. Then download the simulation data to your computer. The screenshot below shows downloaded simulation data. In the last two columns (G and H) you can see the label and data for the Chicago Store and the Columbus Store. Also note that the downloaded data is trimmed off at 30 days as described in the section above on importing simulation data.

After you download and trim the simulation data, click on cell A1 in the upper left corner of the spreadsheet. It is the cell with the words “On-hand report” as shown in the screenshots below. Select all data (Ctrl-A); and then copy that data (Ctrl-C). Apple computers use the Command key instead of the Control key. So to select all data on an Apple computer, put your cursor in cell A1 and hold down the command key and the letter A (Cmnd-A); then to copy that data, hold down the command key and the letter C (Cmnd-C), etc.

Open the downloaded spreadsheet template with the P&L report. Click on the “Simulation Data” tab at the bottom left of the spreadsheet screen as shown above. On the Simulation Data worksheet, click on cell A1 in the upper left corner of the spreadsheet. Select all data (Ctrl-A); then insert new data (Ctrl-V) you just copied from the spreadsheet with the downloaded and trimmed simulation data.
Now click on the “P&L Report and KPIs” tab and you will see the new P&L Report generated by the new simulation data you just cut and pasted into the Simulation Data worksheet. BUT if you added more facilities, such as stores in Chicago and Columbus, you need to add new columns in your P&L Report to show data for those facilities. Do this by copying the column in the report for the Ft Wayne Store to display data for the new stores in Chicago and Columbus.

Paste the column you copied for Ft Wayne into the next two columns in the spreadsheet (columns H and I). Note the store name, Ft Wayne Store, is repeated in the next two columns, but the numbers are different. That is because the formulas used to read simulation data for Ft Wayne are now reading from the simulation data for the next two stores, Chicago and Columbus, and displaying that data in columns H and I. Type in the two new store names over the Ft Wayne name.

The last step is to modify the equations in the spreadsheet cells of the Total Company column – Column B highlighted below. Click on each cell in the column and you will see the equations used to calculate those numbers. In many cases you will see an equation that refers to a range of columns, C to G. Extend the range for those equations to column I. This will include the two new columns showing data for the Chicago and Columbus stores in the calculations for total company numbers.

Template reporting logic is related to how a supply chain model is built (such as the Cincinnati Seasonings supply chain model in the online library). The simulation data downloads in a sequence determined by the order in which products, facilities, and vehicles were added to or deleted from the supply chain model. This means you need to change the way the reporting tab reads downloaded simulation data whenever you add or delete a product, facility, or vehicle. Look at how the “P&L Report and KPIs” tab reads data in the “Simulation Data” tab. Make changes as needed.
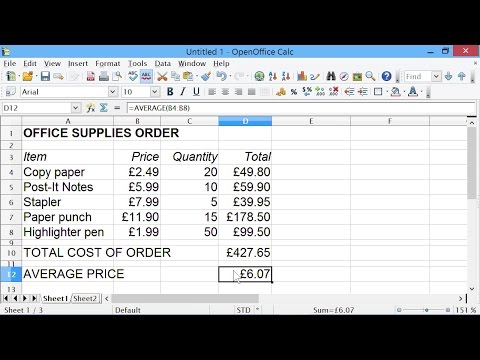
VIDEO TUTORIALS ON USING SPREADSHEETS
Go to YouTube and search on “Spreadsheet Tutorials” or other relevant phrases. Here’s the first video of a popular series: