


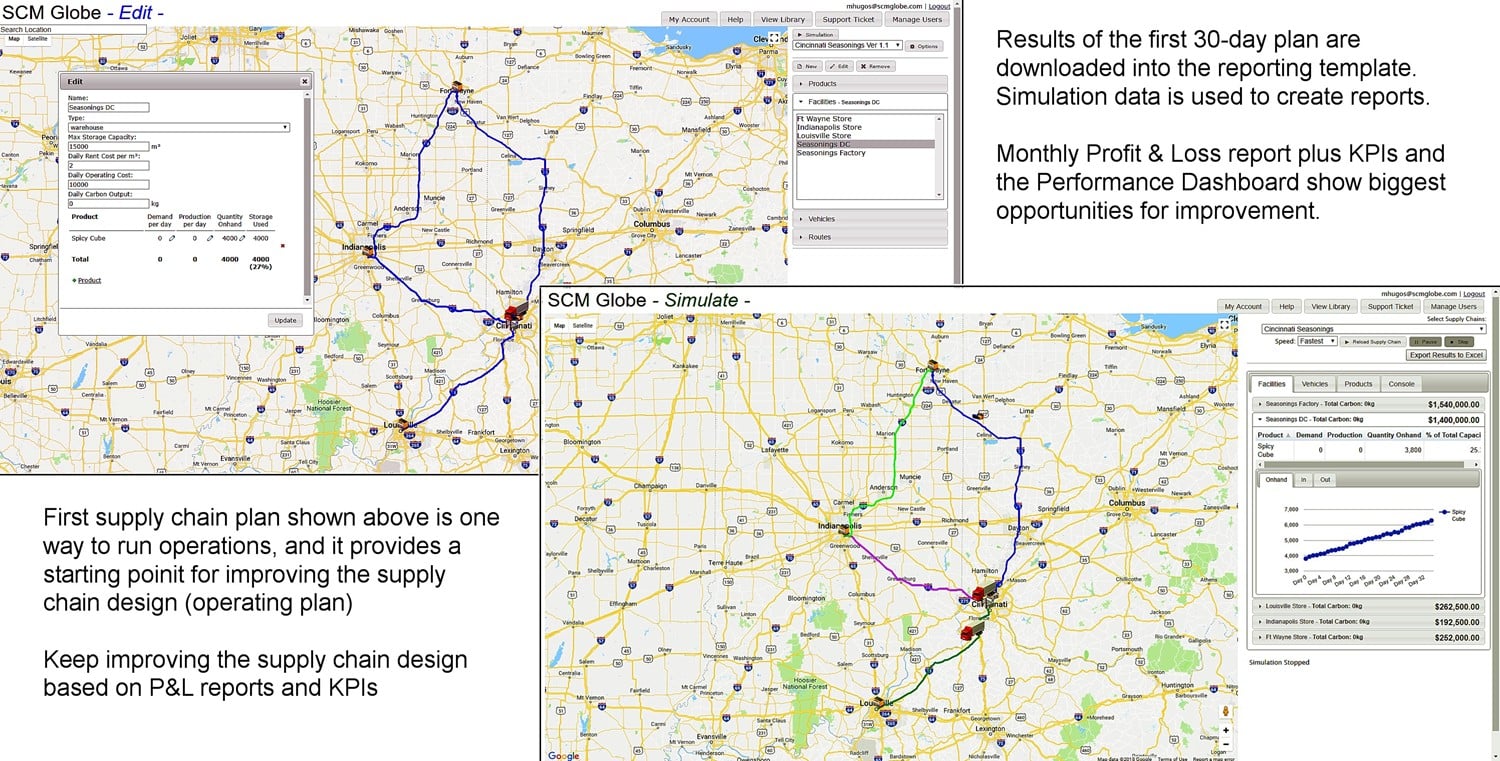
An effective approach to working with case studies is to first do whatever you feel is needed to get your supply chain to run without breaking for 30+ days. That generates an initial set of simulation data that can be analyzed and optimized. The two screenshots below show one solution to get the Cincinnati Seasonings supply chain to run for 35 days. This provides a baseline dataset to use in the supply chain Optimization Template.
Supply Chain Optimization Template
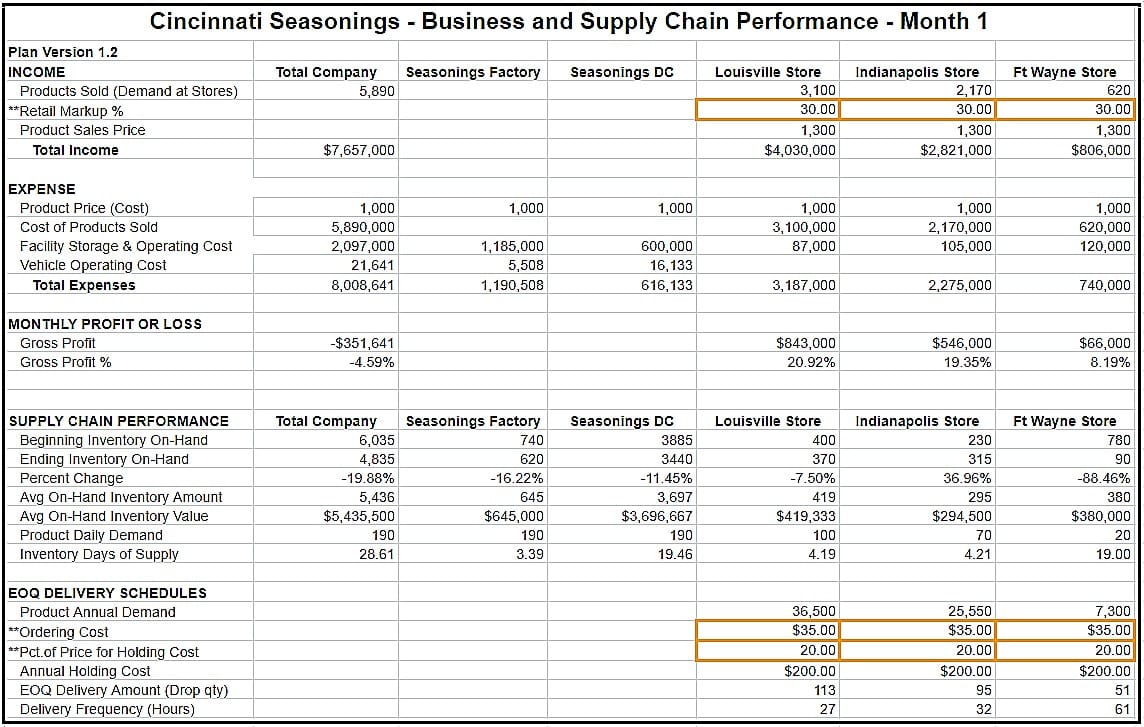
The optimization template shown here improves on the standard version of the PROFIT & LOSS REPORT template described in Analyzing Simulation Data. Download your simulation data and trim it to 30 days, then copy it into the beta test template. As shown below, the new template includes the original Profit & Loss report and KPIs and it adds a new feature that uses the EOQ formula to calculate optimal delivery amounts and frequencies for the stores.

NOTE: Orange bordered boxes on screenshots above and below show where direct input from users is needed, the rest comes from downloaded simulation data.
Building on the original P&L report and KPIs, there are two new tabs in the beta test Optimizing & Reporting template. The first tab is the performance dashboard as shown below. It provides a high level view of overall supply chain performance. You assign weights to each of the performance categories (Inventory, Transportation, and Storage) to reflect your strategy for improving operations. Assign higher weights to things that are more important and it will focus attention on the performance categories you most want to improve.
The dashboard then calculates percent effectiveness for each facility by comparing the simulation results to the predefined performance targets. Based on the weights assigned to each target, a net performance score is calculated for the whole supply chain. This is shown below circled in red.
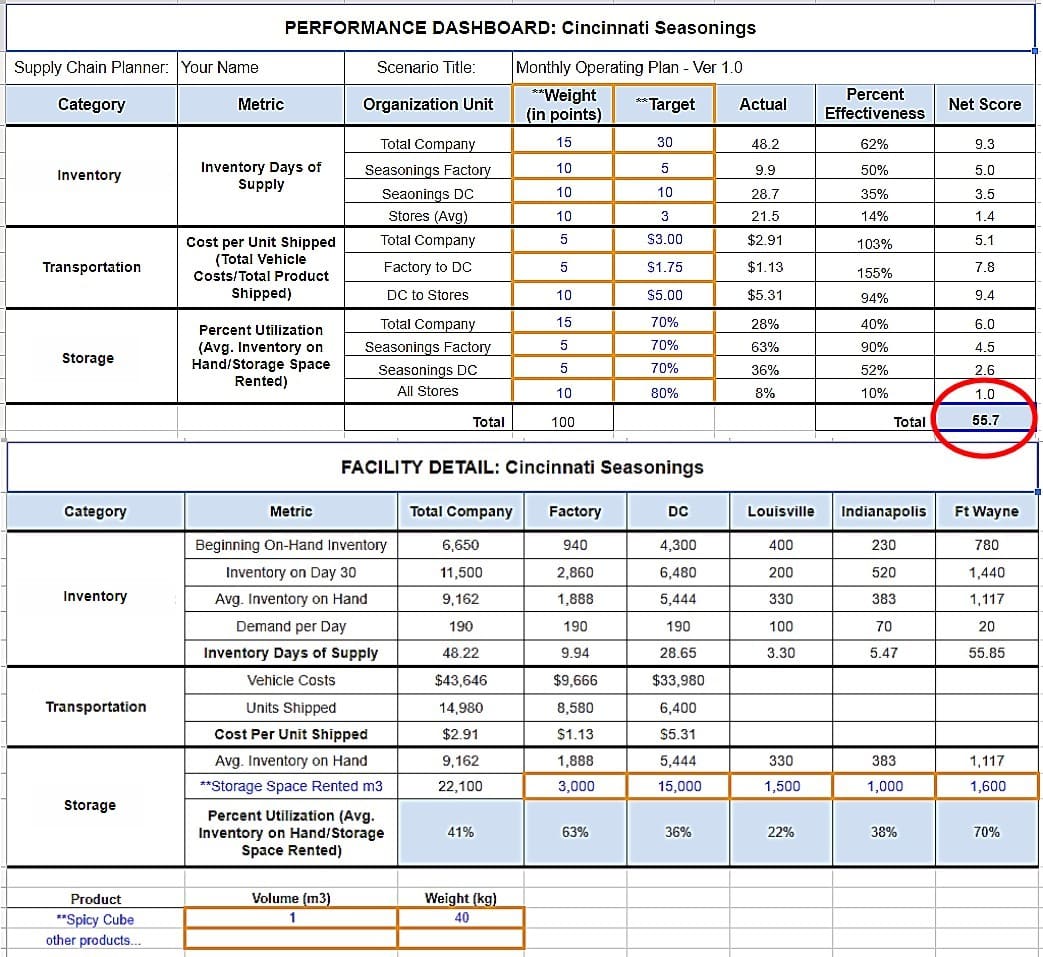
The second new tab is facility detail as shown above. This tab provides more insight into operations at individual facilities and pinpoints the biggest opportunities for improvement at those facilities. The performance dashboard and facility detail tabs show you where the biggest opportunities are for improving overall supply chain performance.
Focus on Most Important Improvements
Improvements can always be made in any area of a supply chain, but the key is to find the improvements that will deliver the largest overall benefits. In the example above, you can see that transportation costs and operations are working well enough, so you do not need further improvements in transportation even though they can be found. Instead, your best overall benefits will come from focusing on improvements in operations at certain facilities.
Based on this information, you then make specific improvements to your supply chain model (the model is also the supply chain operating plan). In the example above the dashboard focuses your attention on improvement opportunities such as:
- Synchronize production at the factory with demand at the stores
- Deliver less inventory to stores to reduce inventory days of supply
- Reduce storage space at stores to lower rent cost and improve storage utilization
- Redesign delivery routes and frequencies to further reduce costs
After taking those actions your supply chain model will look different. An example is shown below. What is shown below is just one step along the way, and there are more improvements that can still be made. Each time you make improvements to the supply chain model, you run the simulation again.

Then export the simulation data and import it into the reporting template. As shown below, these improvements result in significant increases for overall supply chain performance. In the screenshot below, the monthly loss on gross profit is reduced from $1,552,646 in the first report to $351,641 in this second report (that is a 77% improvement).
NOTE: Facility rent costs in this case are are set higher than market rates so profitability can only be reached through increased sales from opening new stores.
The dashboard below shows a big improvement in overall supply chain performance. In the first dashboard the overall performance Net Score was 55.7. It has improved in the second version to 86.1.

The facility detail tab shows improvements in the percent utilization for storage space at all of the facilities. The dashboard and facility detail tabs continue to identify the biggest areas for more improvement. By continuing to make changes in those areas you can continue to optimize the operations of this supply chain.
In this process of continuous improvement, your supply chain design and the designs of others who are working on the same case will all converge on one or two optimal solutions regardless of individual starting points for those designs. People’s designs will not be identical, but they will become more and more similar as they keep making improvements to optimize their designs. After four or five iterations, if people keep changing their supply chain models based on what the optimizing templates show them, everyone’s supply chain model will be quite similar, almost the same except for small details that are not significant. See more about this in The Butterfly Effect.
Two Different Optimizing Templates
The Optimization Template assumes all products are shipped in SAME SIZED CONTAINERS. The container can be any size from a standard case or pallet load, to a 40 foot shipping container.
Download a copy of the Optimizing & Reporting template here
When products are shipped in DIFFERENT SIZED CONTAINERS please use the Mission Reporting template. It has an operating report and performance dashboard, and it can handle different sized products and containers. It can be used for Commercial, Military and Humanitarian supply chains. The template is built for a 15-day period, but can be extended to 30 or more days as needed. The operating report shows facility and product detail, and the dashboard shows where the best opportunities are for improvement.
Download a copy of the Mission Reporting template here.
Importing simulation data into reporting templates is explained under the heading “Import Simulation Data into Spreadsheet Reporting Template” in the online guide section “Analyzing Simulation Data”
NOTE: For a full discussion of available simulation data and how to use it, please read the online guide section Supply Chain Modeling and Simulation Logic.
CONTRIBUTOR CREDIT: This optimizing template was contributed by Robert Scanlon who created the template to help him manage several large distribution centers and focus his staff’s attention on improving the most important areas of operation. He is a management consultant, and adjunct professor (scanlonro
Other templates are available to help you optimize supply chain operations. In addition to the two templates shown above, here are some other templates where you can use data from your supply chain model and your simulations to analyze and improve your supply chain:
- Explanation of capacitated plant location (CAPLOC) model — download a clear and concise set of lecture slides from University of Colorado at Boulder, Leeds School of Business
- Capacitated plant location template — video showing how to use Excel spreadsheet and Solver to set up a model and determine optimal plant locations
- Spreadsheet Solver for Vehicle Routing Problems — see our blog post on how to use the Excel Solver to analyze and improve vehicle routing and scheduling