
Occasionally in the real world missed deliveries happen, and products don’t arrive on the day they were scheduled to arrive. In SCM Globe simulations it also happens that way. As you get familiar with the simulation and the data that is created, you will notice that sometimes a scheduled delivery doesn’t happen. Sometimes you will see just one missed delivery at a facility and sometimes multiple missed deliveries happen with a regular frequency. It’s not a bug; it’s a feature to add realism to the simulation… seriously… 🙂
The cause of missed deliveries in the simulation originates in the way you define a vehicle and its delivery route. When you define a vehicle there is a variable called “Delay Between Departures”. If you set that delay to 24 hrs, that means the vehicle will run its route and return to its start location and depart again 24 hours later. If the route takes 4 hours, then the simulation begins calculating the next departure as 24 hours after the completion of the 4 hour delivery route. So the departure of the vehicle keeps getting pushed up by 4 hours every time the vehicle runs its route. In this case, after six departures and the addition of 6 x 4 hrs = 24 hrs to the time between departures, it pushes the departure into the following day. So a departure does not happen at all for that vehicle on that day.
Safety Stock is Needed at Facilities
That means facilities need to carry “safety stock” inventory to meet product demand when missed deliveries happen. And this same logic for calculating departures can sometimes cause a delivery to be made twice when only one was expected. So you also need to have some extra storage capacity at facilities to accommodate occasional extra deliveries.
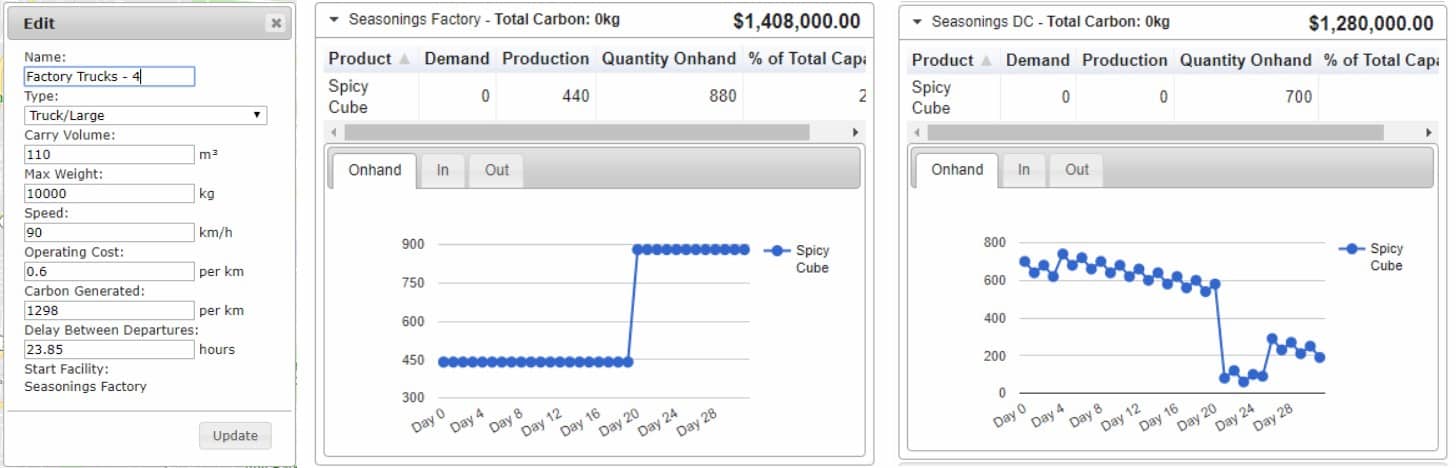
This is illustrated in the screenshots below. The display on the left shows a factory making 440 products per day. A vehicle at the factory delivers 440 products every day from the factory to the DC which is shown in the display on the right. But then one day (Day 20) the vehicle at the factory does not make a delivery to the DC so on-hand inventory at the factory jumps up by 440 units (daily rate of production), and on-hand inventory at the DC drops by that amount plus an additional amount equal to deliveries made from the DC to other facilities.

How to Reduce Missed Deliveries
Subtract the travel time for the vehicle on the route from the delay between departures for the vehicle. When you edit a route, you can see the time it takes to travel the route. For instance, if the vehicle takes 4 hours to travel its route you can subtract 4 hours from the delay between departures and get more regular daily departure on all days: 24 – 4 = 20. Set the delay between departure to be 20 hrs.
If you want a vehicle to do two deliveries every day then calculate delay between departures by dividing 24 by 2 and subtract the route travel time: 24/2 – 4 = 8 hrs. Use your judgement about how small the delay between departures can be. The delay must be long enough to at least provide time for a vehicle to drop off or pick up products at its starting facility, refuel, and let the driver take a break. Delays less than 4 hours are usually not realistic. And a negative number for delay between departures makes no sense, so do not use negative numbers.
[ NOTE: When you create a new route it will show ROUND-TRIP distance and time, but if you drag/drop a new route to follow a different road than the one first shown, the distance shown will revert back to ONE-WAY. Read about this in the FAQs Bug Report – Scroll down to BUG 1 ]
.
Shown in the example below is a vehicle defined as four large trucks that moves products between the Cincinnati Seasonings factory and the Seasonings DC. Vehicle speeds are 90 km/hr and they travel on a route measured as 13.79 km. The delay between departures for all the trucks is set at 23.85 hours. These vehicle and route numbers are what produce the two on-hand inventory graphs for the factory and DC shown above. But even these seemingly accurate numbers cannot entirely eliminate missed deliveries. There is still a day when missed deliveries happened… Why is that?
ROUNDING ERRORS are inevitable because the SCM Globe simulation engine does its calculations at 16 decimal places, and we display only 2 decimal places on screen. In some cases you will find you cannot eliminate all missed deliveries over a 30 or 60 day period.

To eliminate all rounding errors you would have to do your calculations at 16 decimal places just as the simulation engine does
It is impossible to duplicate exactly the calculations done by the simulation engine at 16 decimal places if you do your calculations at only 2 decimal places. In the thousands of calculations that occur during simulations, small rounding errors that occur when rounding from 16 decimal places to 2 decimal places accumulate and can change expected results by an hour or two one way or the other.
BUT there is no reason to eliminate all rounding errors or missed deliveries!
Rounding errors and their missing or added hours disrupt expected delivery patterns, and they are an example of the Butterfly Effect. In this way they add a realistic element of uncertainty and variability to the simulations. SCM Globe uses this butterfly effect to model the reality that things do not work perfectly and predictably in supply chains every day. It actually makes the simulations more realistic than they would otherwise be if there were no rounding errors and no uncertainty or variability.
Managing Safety Stock and Storage Capacity
Uncertainty in the real world is why supply chain managers keep safety stock inventory at facilities, and the Butterfly Effect in the simulations forces you to do the same in your supply chain model. Safety stock enables facilities to operate even if needed supplies do not arrive as planned. Usually safety stock at a facility is set to the amount of inventory used during one delivery cycle. If deliveries are made every day, then safety stock is one day’s worth of inventory usage. If deliveries are made every three days, then safety stock is three days worth of usage, and so forth. And in addition to carrying safety stock at a facility to cover missed deliveries, there also needs to be a bit of extra storage space at facilities to cover unexpected deliveries.
Think about reducing percentages of missed deliveries instead of trying to eliminate all missed deliveries. It is more realistic to create supply chain models with low percentage rates of missed deliveries than to create models with absolutely no missed deliveries. Perfect supply chains do not exist in the real world. And perfectly accurate supply chain models do not exist either. Read more about this in All Supply Chain Models are Approximations.
The screenshots below illustrate the effects of percentage reductions in missed deliveries, and show the reduction of inventory on-hand amounts that result.

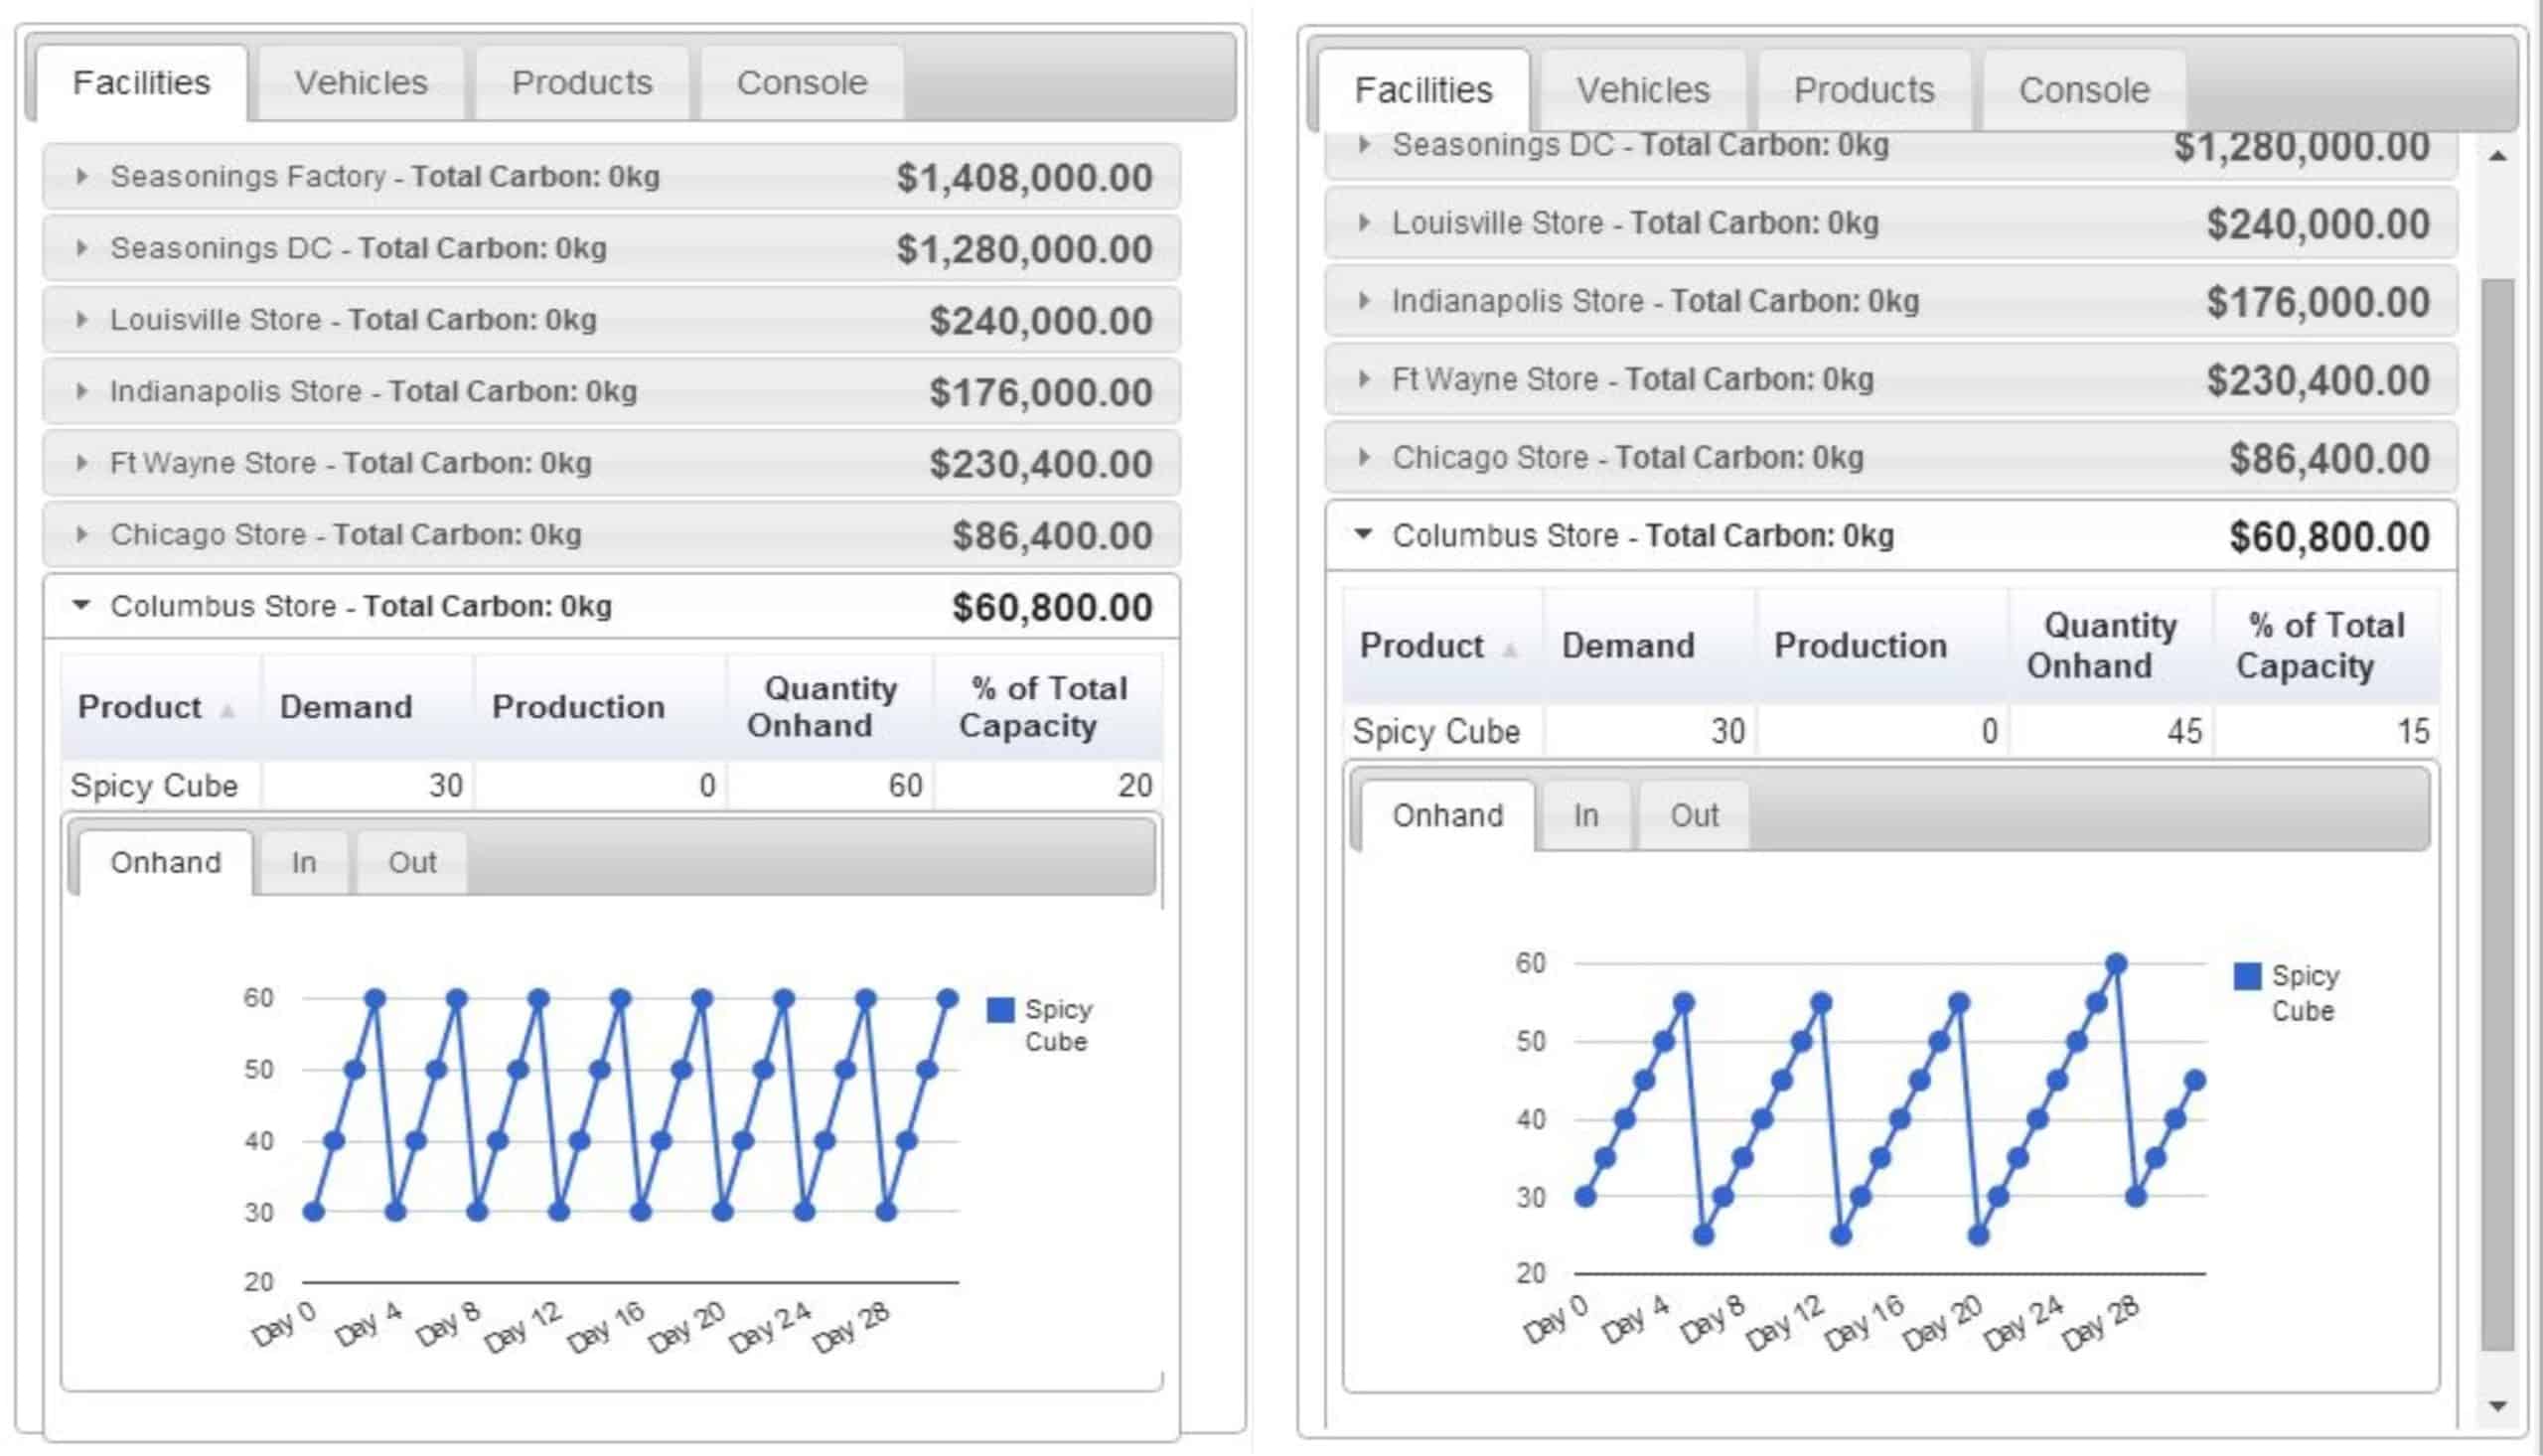
The graph on the left above shows a baseline missed delivery rate in a simulation using a 24 hour delay between departures on a particular route. The graph on the right shows the result of a 50% reduction in missed deliveries (subtract half the travel time on the route from the delay between departure). Notice how on-hand inventory levels fluctuate inside a lower range: 25 to 55; versus 30 to 60.
Notice how average on-hand inventory over the entire period is also lower in the graph on the right. Due to fewer missed deliveries, delivery quantities can be smaller making average on-hand inventory lower. Delivery quantities can be smaller because fewer missed deliveries means there is less need to continually replenish safety stock.

Above on the left is the result of a 75% reduction in missed deliveries (subtract three quarters of the route travel time from the delay between departures). This causes on-hand inventory to fluctuate within an even smaller range, and the average on-hand amount over the entire period continues to drop.
Above on the right is a 100% reduction in missed deliveries with no fluctuation in on-hand amounts over the entire simulation period. Notice how on-hand inventory level is maintained at 30 because it is the appropriate safety stock level when deliveries are made on a daily basis and daily product demand equals 30. This sequence of inventory graphs illustrates why as the number of missed deliveries decreases, it is possible to lower on-hand inventory. And with less on-hand inventory it is possible to also reduce related rent and operating costs associated with that inventory.
It is important to note the example above eliminates 100% of missed deliveries over the 30 day period shown, but a missed delivery does occur on day 36 of the simulation that produced this on-hand inventory graph. Because of rounding errors it is simply not possible to calculate a delay between departures (at 2 decimal places) that will produce a simulation (calculated at 16 decimal places) with a complete elimination of missed deliveries over time.
As you build more realistic and complex supply chain models be sure to use the modeling techniques presented in “Tips and Techniques for Building Supply Chain Models“