


The Academic version of SCM Globe limits supply chain models to about 20-25 different products, and a similar number of facilities, vehicles, and routes. The Pro or Business version can accommodate 50-75 products, facilities, vehicles, and routes depending on the amount of memory available (16 – 32 GB required) and the power of the CPU in the computer running the simulations. Manage these limits by creating high level models to simulate supply chain operations on a global or regional scale. Then build lower level models of specific sections of a supply chain to simulate those operations in greater detail (see the case study “Disaster Response Supply Chains” for an example of regional level and city level models in the same case).
Manage the level of detail and complexity in your model by how you define the four supply chain entities and how you set your model boundaries and scale. Tips and techniques are shown here to help you create accurate and insightful supply chain models. Please see the section below on the “Day 0” calculations that start each simulation. Also remember, “All Supply Chain Models are Approximations“, so use the best available data and estimates, but do not obsess over excessive levels of precision.
** IF YOU PURCHASED the BUSINESS EDITION: SCM GLOBE PRO — Please contact us (info@scmglobe.com) to activate the data import/export features, and the automatic modeling and reporting features of SCM GLOBE PRO. Academic users get a 50% discount when they upgrade to SCM Globe Pro.
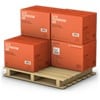

Define a product as a multi-unit shipping case or pallet load of that product. For instance, if Product A is typically shipped in cases of 100 items, then define Product A using the price, weight and volume data for a 100 item case, not an individual item. An exception to this rule is if your product is already a large item such as an automobile, or a big piece of furniture, or heavy equipment, etc. Otherwise, your supply chain model should track products at the multi-unit case or pallet load level. There is no need to define the cost, weight and volume for an individual product item unless you are doing low level modeling of a part of a supply chain in great detail.
Sometimes it is convenient to define product price, weight and volume to correspond to standard size shipping containers. Standard shipping containers for rail or ocean freight are typically 20 foot or 40 foot containers. Air freight container sizes are usually smaller. Do a web search on “standard shipping container sizes” for more information on sizes and carrying capacities. If you wish to always deliver a product in 20 foot container quantities (33 cubic meters), then you can define that as the size of the product. When you ship this product use a vehicle with the capacity to handle the volume and weight of such a product.
It is also useful at times to group similar products together under a single product category or “kit” (in manufacturing a kit is also known as an “assembly” or “sub-assembly”). For instance, a product labeled “Furniture C” could be a collection of similar furniture items all shipped together in a single 40 foot container. In that case you would define the Furniture C product using the price, weight; and volume numbers for an entire cargo container loaded with the product. Another product called “Home Hardware” could be a collection of related products (such as nuts, screws, hinges, door knobs, etc.) that are typically shipped together in a single standard package or kit (in automobile manufacturing an assembly might be a seat, a sub-assembly might be the instrument panel for the car). You would define this product using price, weight and volume numbers for the entire package or kit.
Set the price of raw materials or sub-components a company buys from suppliers equal to the purchase price for those items. For the price of products a company sells to its customers, set the product prices equal to the company’s standard cost for those items. Then, when you import simulation data into a P&L reporting template, you can set different retail markup percentages for different products at different sales locations to reflect actual sales prices for those products.
When you open new facilities, you generally want to have a week or 10 days of products on-hand at the facilities to meet daily demand. As a practice, most companies have a bit more on-hand inventory at new facilities than they actually expect to need, but this extra amount acts as a buffer against uncertainty. After all the analysis is done, a new facility is still a new facility with no history, so there is uncertainty. On-hand amounts can always be adjusted later in simulations for following planning cycles (scroll down to TIMELINE to see more about sales and operations planning, or S&OP, cycles).
At the start of a simulation, there must be at least two days of product on-hand to meet demand at all facilities. At least one day (and maybe more) is needed for new supplies to reach a facility, and one day’s supply of product will be consumed in the “Day 0” calculations that start all simulations (scroll down to “DAY 0″ CALCULATIONS AND ADJUSTMENTS” to see more about these calculations). Standard practice in real supply chains calls for facilities to be opened with some inventory already on-hand (usually enough to cover 7 – 10 days of operation). And existing facilities will also have several days of inventory on-hand as safety stock as well.
Learn more about how to reduce inventory and operating costs in the section titled “Cutting Inventory and Operating Costs”
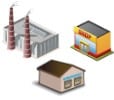

When placing facilities on the map it is best to put facilities in their actual locations if they are real facilities, and in realistic locations if they are proposed facilities. To find the location of real facilities you can type the facility address into the “Search Location” box in the upper left corner of the Edit screen and it will take you to that location. Or you can click the “Satellite” button under the Search Location box and zoom in to see the actual location in a satellite picture or street view. To find realistic locations, go to the city where you want to locate a facility and type a search phrase in the Search Location box. For instance, if you are going to open a sporting good store in Kansas City, go to Kansas City on the map and type in “sporting goods” in the search location. It will suggest various sporting goods stores in Kansas City and you can pick one.
Or turn on the Satellite view and zoom in to find industrial parks for factories and warehouses and shopping districts for stores. In the satellite view you can also locate actual harbors, airports and distribution centers for placing proposed facilities of these types. And of course you can also place facilities where none currently exist if you propose to build new facilities in such locations.
Depending on the level of detail of your model, you can have one facility stand for a group of facilities in the same geographical area, or there can be a different facility created in the model for each actual facility. For instance, if you are modeling a retail supply chain on a national or regional level, it works best to simply create one store in each city and have that one store represent all the individual stores in the city. If you are modeling a local supply chain in one city then you can create facilities in the model for all the stores in that city.
When one facility stands for a group of facilities, define that facility as having the combined storage capacities, production rates, demands, and costs of all the facilities it represents.
In the simulations all facilities operate 24 hours per day, seven days per week. When you set daily product demand, production rates, and operating costs for facilities, think of them as monthly averages divided by 30 to get daily numbers. To see the effect of different production rates, demand levels, and operating costs you can change those numbers and see what results occur in the simulations. Set safety stock levels based on simulation results that reflect your best monthly forecast for what average daily demand, production rates, and operating costs will actually be. All facilities must start simulations with on-hand inventory equal to at least 2 days or more.
Assign on-hand inventory to each facility as it should be at the start of your simulation. Then as the simulation plays out, you will see how on-hand inventory changes. Assign production per day to facilities that make products (such as factories), and assign demand per day to facilities that consume or sell products (such as stores). Do not assign demand to facilities where products are only stored for delivery elsewhere (such as warehouses) because the on-hand inventory will be reduced as vehicles take products from those facilities and deliver them elsewhere. Also see “DAY 0″ CALCULATIONS AND ADJUSTMENTS section below to understand how on-hand inventory at some facilities may be adjusted at the start of a simulation.
You don’t need to enter rent expense, operating costs, and carbon generation for facilities your company doesn’t own or operate (you can if you want to). For the facilities of suppliers or customers you can set those numbers to zero. However, you should enter rent, operating costs, and carbon generation numbers for facilities your company owns or operates.
Many individual costs associated with facilities such as: inventory carrying costs; cost of utilities, cost of insurance, cost of maintenance, cost of labor, etc. are not recorded as separate costs. Instead, they are included in the two main aggregate costs assigned to every facility. Those two main costs are Daily Rent Cost and Daily Operating Cost. Other costs such as inventory carrying costs are themselves aggregate numbers composed of costs such as: cost of capital invested in inventory; cost of rent; cost of utilities; cost of taxes; cost of handling etc. Therefore, make estimates of inventory carrying cost and other relevant costs when you calculate the Daily Operating Cost for a facility. In different 30-day periods those costs may vary so, run different simulations with those variations as you explore their effects in different 30-day periods.
To focus your model on a supply chain that begins with a certain facility such as a factory or warehouse, you do not need to show the supplier facilities and routes that deliver products to that beginning facility. Instead, you show those incoming products as being produced at that beginning facility. Show the products as being produced at a daily rate equal to the average daily delivery of those products over a 30 day period. Relevant costs associated with the delivery or procurement of these products should be added to the daily operating cost for that facility.
The same is also true for a facility where a supply chain model ends. If you are modeling the supply chain of a manufacturer or a distributor, then the supply chain model may well end with a warehouse. In that case, show product demand at the warehouse as equal to deliveries made to retailers who get their products from that warehouse.
For MILITARY supply chains there is an example of modeling and simulating logistics problems associated with supporting columns of troops on the march – THIRD CHALLANGE in the Alexander the Great case study
STARTING TEMPLATE FOR COMMERCIAL SUPPLY CHAINS is available in the library of case studies. This template comes with a set of default products and facilities. Go to the library and scroll down to “Commercial Supply Chain Template” and import a copy into your account. You can rename and redefine the products as needed or add new products. Any extra products in the template just leave alone. Drag and drop facilities to the locations where you want them. Then rename and redefine the facilities as needed. Delete any extra products assigned to those facilities and delete facilities in the template that you don’t use. Then add vehicles and routes as needed to complete your model.
STARTING TEMPLATE FOR DISASTER RESPONSE / MILITARY SUPPLY CHAINS is also in the library. This template comes with 10 predefined products, each product stands for a pallet-size container of one of the 10 classes of humanitarian supplies. These are the 10 classes of supplies defined by the World Food Program (WFP), the United Nations (UN) and other disaster response and humanitarian organizations. The icons used for the predefined facilities are the standard facility icons used by the WFP and the UN (for military supply chains, replace the 10 classes of humanitarian supplies with the 10 classes of military supplies as defined by the U.S. DoD – these are shown in the Syria Evacuation Scenario case study). Some facilities also have default vehicles assigned to them. Drag and drop facilities to place them in desired locations, add/change/delete the entities as needed. Add delivery routes for vehicles and you quickly have a supply chain model ready to simulate.
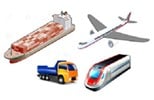

You define your vehicle as one of four types of vehicles: Airplane; Ship; Train; or Truck. This determines the kind of route that will be drawn for the vehicle when you use it in a supply chain model. Airplanes and ships will create routes that are straight lines between starting and ending facilities. Trains and trucks will create routes that follow the largest roads between starting and ending facilities. All initially drawn routes can be changed as needed using drag/drop to select other routes (see more below in Routes).
One vehicle may stand for a group of vehicles, for instance, if a fleet of 10 trucks is required to deliver products to a given facility, then simply create one vehicle that represents 10 trucks. Define that vehicle as having the combined cargo volume and weight capacities and costs of all the vehicles it represents. This vehicle will then have one route that all the represented vehicles will follow. For more detailed and lower level models you can create separate vehicles for each individual truck.
Vehicle speed equals average speed over the length of a route. This means the vehicle speed is not just the top speed a vehicle can travel. Speed is dependent on factors such as the condition of the roads on the route, the amount of traffic on the route, and the time it takes to load and unload products at stops where products are picked up or delivered.
- For instance, suppose a medium size truck with a top speed of 130 km/hr (about 80 mph) travels on a 100 km delivery route where some roads are in bad repair, one is a dirt road, and there are 5 stops with an average time per stop of 15 minutes.
- Estimate how road conditions affect speed. The truck could travel at different speeds on different sections of the route, but you might estimate the overall average speed on these roads will be 64 km/hr. (about 40 mph). This means it would take 1.56 hours for a truck traveling 64 km/hr to travel the 100 km route.
- Then add in the time for loading and unloading products at the five stops: 5 x 15 mins = 75 minutes or 1.25 hours. Add 1.25 to 1.56 hours = 2.81 hours to complete the route.
- Now you can calculate the average speed of the vehicle on this route: 100 km / 2.81 hrs. = 35.59 km/hr.
- When entering this data into your supply chain model it is best to round it to the nearest single decimal place or whole number. You can use two decimal places but it implies a degree of control and precision which is unrealistic for supply chains in the real world. See more about this in “All Supply Chain Models are Approximations“
“Delay Between Departures” is how you set departure frequencies for a vehicle. At the start of a simulation all vehicles depart on their routes. Then they return to the facility where they are based and wait for the number of hours in their delay between departures before starting their route again. If you set the delay between departures to eight hours, it means the vehicle will travel its delivery route, return to its starting facility, and wait for eight hours before departing again. In most cases, to be realistic, this delay should be 4-6 hrs. or more. By setting the delay between departures you define the average number of departures per day made by that vehicle.
Vehicles can have one or more routes. For example, to add two routes to a vehicle select the vehicle and define a route for it going to Facility A, save that route and then define a second route going to Facility B. When the simulation begins the vehicle will run the first route defined for it. Then the vehicle returns to its basing facility and waits the number of hours shown in the Delay Between Departures. Then the vehicle will run its second route to Facility B and return to its basing facility. It will wait the number of hours shown in Delay between Departures and run the first route again, etc.
Model a stream of vehicles delivering products to a facility every day or every week even when it takes longer than a day or a week to travel to that facility:
- Suppose a truck or a ship travels a route that has a round trip time of three days at speeds the truck or ship would normally travel. BUT you want to show product shipments being sent and received every day.
- Model this by setting the delay between departures for the vehicle to zero, and increasing the speed of the vehicle so the round trip time is reduced from three days to one day.
- Now the simulation will show a stream of shipments leaving every day from an originating facility and arriving every day at a destination facility. Model a stream of vehicles like this with a single vehicle traveling at a higher than normal speed. Transportation cost is still accurately recorded because transportation cost is determined by distance traveled and frequency, not by vehicle speed.
- If you are modeling ONE-WAY trips of shipping containers, be sure to set vehicle operating cost to half of normal cost to model cost of one-way shipments.
- If you are modeling ROUND-TRIP movement of company owned vehicles, then keep operating costs at their full cost.
Vehicles sometimes miss deliveries in the simulations (as they do in the real world). You can accept these missed deliveries, or compensate for them if you wish – see more about this in Deliveries Do Not Always Work Perfectly.
Make vehicle wait before departing on its first delivery route — all vehicles depart on their routes at the start of a simulation; but there is a workaround:
- Adjust the amount of inventory that would be added or subtracted from on-hand amounts at a facility if a vehicle did wait for some number of hours or days before departing.
- For instance, if daily production at a factory is 350 units per day (24 hrs) and a vehicle moving products from the factory to a warehouse waited for 72 hrs before its first departure from the factory that would allow for 350 x 3 = 1,050 extra units to build up in on-hand inventory. So add an extra 1,050 to the beginning amount of product on-hand to model a 72 hour delay.
- Alternatively, if demand at a store is 15 and you want to model the effect of a delivery waiting for two days from the start of the simulation, then subtract 2 x 15 = 30 units from the on-hand amount at that store at the start of the simulation.
Model shipments using a third party logistics provider (3PL) by modifying the vehicle operating cost as needed. If you pay only for one-way shipment of products then reduce the vehicle operating cost by 50 percent. You would not do this when modeling use of company owned delivery trucks, or vehicles where full round trip costs are paid for by the company.
Make a one-time delivery or pickup of products at a facility, add a vehicle that can carry the required volume and weight, and set its delay between departures to be 1,000 hours. This will cause the vehicle to depart once at the start of the simulation and deliver or pick up products to facilities specified on its route.
Then it will return to its starting facility and wait 1,000 hours before departing again. That means it won’t depart again until after a 30-day simulation period is over. NOTE: Day 0 adjustments are needed when using one-time deliveries or pickups – see DAY 0 ADJUSTMENTS below.
When modeling pipeline networks (oil and gas, or water pipelines etc.) create a vehicle with a carry volume equal to the hourly or daily volume of the pipeline (for example 100 m3 per hour, or 2400 m3 per day). Name this vehicle Pipe1, Pipe2, etc. and assign it to the starting facility of the pipeline. Then draw in a route for the pipeline (use same technique as for a ship or barge route shown in the Route section below). Set the speed and delay between departure for the vehicle so it makes one trip per hour if using hourly volumes, or one trip per day if using daily volumes.
For trains, airplanes and ships you are usually working with shipping containers that are carried by these vehicles. For instance, you define a vehicle used to deliver products across an ocean as a ship, and the cargo capacity is determined by the number of shipping containers you use on that ship. If you use one standard 40-foot or 20-foot shipping container then the volume and weight of products you can ship are determined by the capacity of that container. If you need more capacity then add more containers. For instance, you can define a vehicle as being ten 40 ft. shipping containers, and this vehicle would have ten times the capacity and cost of a single 40 ft. container. Cargo carriers will tell you the cost of different sizes of containers so use that to calculate the operating cost of the vehicle you create.
Carbon generation numbers for vehicles are always changing as technology changes, so do a little research and see what you can find. Here are some basic estimates you can use to get started. These numbers are already entered as default values when you create new vehicles (numbers are conservative and may be lower than actual emissions):
- Large Diesel Truck (110 m3) – 0.9 kg carbon per km
- Medium Truck (60 m3) – 0.7 kg carbon per km
- Small Truck (40 m3) – 0.5 kg carbon per km
- Train 40 ft freight container (65 m3) – 0.1 kg carbon per km
- Ship 40 ft freight container (65 m3) – 0.02 kg carbon per km
- Jet Airplane freight container (6 m3) – 1.2 kg carbon per km
Roll-on/Roll-off (RORO) is used for shipping wheeled vehicles such as cars and trucks. If you want to create a supply chain model using RORO then define the container size to be the same as the size of one or more wheeled vehicles. If you are using a RORO vessel and want to ship 100 cars and each car is 9 cubic meters in size, then define a container of 900 cubic meters and it will accommodate those cars. Cargo carriers using RORO will tell you shipping costs per vehicle so use that to calculate the operating cost for this 900 cubic meter container.
A given percentage of missed deliveries can be modeled by reducing the storage capacity of a vehicle. For instance if you want to model the effect of a 20 percent missed delivery rate over a 30-day period, then reduce the storage capacity of the vehicle by 20 percent. That means delivery amounts will also need to be reduced so that vehicle will deliver 20 percent less product on its delivery routes. This models the average effect over a 30 or 60 day period without specifying the exact days when deliveries are missed. To make up for the percentage reduction in product delivered, you will need to compensate by either making larger shipment amounts or making more frequent shipments or some combination of the two, just as you would in the real world.
LIMITATION in Vehicle Modeling Logic: The SCM Globe simulation engine calculates hourly snapshots of the status of all the entities in a supply chain. Vehicle event times are the total of a vehicle’s delay between departure plus the route time for its delivery route (Vehicle Event Time = Delay Between Departures + Route Travel Time). As vehicle event times decrease to four hours and less, the probability of simulation engine hourly snapshots missing a vehicle event increases.
1. Vehicle cost and carbon calculations in simulations are calculated using a one hour time progression increment. That means travel times for vehicles are rounded up or down to the nearest whole hour even though actual travel times may be fractions of hours. This will affect calculations for vehicle operating cost and carbon generation. When vehicle event times are 4 hours or less rounding errors can increase from around 10% at 4 hours to 60% or more on routes less than 1 hour. On longer routes (4 hours or more) rounding errors decrease to around 5 % or less as route length and travel times increase. Also, rounding errors decrease over longer simulation periods (15 days or more).
- Adding a stop on a multi-stop route where it takes less than 1.5 hours for a vehicle to move between the added stop and the previous or next stop will cause vehicle operating costs and carbon to be noticeably under counted.
- Single-stop routes where the vehicle event time is 1.5 hours or less will show vehicle operating costs and carbon generation that is over counted by 10 to 80 percent as travel time decreases below 0.5 hours.
- WORKAROUNDS:
- Expand the timeline and make one day of a simulation equal half a day (12 hrs), or a quarter day (6 hrs), etc. See more about this in the section below titled “SIMULATION TIMELINE”
- Reduce the speed of vehicles so that travel times on routes are 1.5 hours or more. This can be done on single stop routes, but may not be practical on multi-stop routes.
- Facilities this close together can be modeled as a single facility with the combined attributes of the included facilities.
- WORKAROUND 1 – Reduce the speed of vehicles so that travel times on routes are 1.5 hours or more. This can usually be done on single stop routes, but may not be practical on multi-stop routes.
- WORKAROUND 2 – Facilities this close together could be modeled as a single facility with the combined attributes of the included facilities.
(The new Enterprise Edition of SCM Globe will use a one minute progression increment to fix this rounding problem and support more detailed modeling of facilities and operations.)

ROUTES
In a supply chain model built at a global or national level, or at lower levels such as region, state, and city, it is important to have routes follow closely to actual routes in the real world. Zoom in on the map when creating routes and see where real routes are or where new ones could be. Routes for trucks and automobiles traveling on existing highways are automatically modeled with a high level of accuracy and usually do not need adjustments.
Automatically selected routes for trucks can be changed when you first create a new route. The initial truck route is shown in light blue. Put your cursor anywhere on the route line and see a black circle appear with the note “Drag to change route”. Left click your mouse and pull the route over to a new road. This is illustrated in the two screenshots below.


The first route to be dragged is the route for the vehicle on its outbound trip as shown in second screenshot. The return route remains the same. You can also change the return route by dragging it over to the new outbound route. Then the vehicle will use the same new route for going to and returning from its destination. Click the “Update” button in the Route edit box to save the new route.
To change existing truck routes, select the truck and the route you want to change, and click the link “Edit Route Line” in the Route edit box as shown highlighted in yellow below. When you click that link a string of white globes will appear along the existing route line at each point where there is a change of direction in the route line (will usually be a lot of white globes). As shown below in the second screenshot, you can zoom in, and drag/drop these white globes to make sections of this route follow different roads instead of the existing route. Click the “Stop edit” link as shown in the second screenshot to save the changed route line, and then click the “Update” button.


To change more than just sections of the existing route, it is better to delete the existing route and recreate that route because there are usually too many white globes to move to change an entire route. As you recreate that route you will see the light blue route line and you can drag/drop the entire route line to select a new road as shown in the first two screenshots above.
Routes for different types of vehicles may require you to make adjustments to improve route accuracy:
- Railroad routes follow the nearest road because usually roads and railroads run closely enough together. However there are times when that is not the case. In that case, define the vehicle as a ship or airplane and the route will draw as a straight line between the origin and destination facilities. Then drag and drop the white globes along the route line to adjust the route to follow actual rail lines more closely. Then save the route and reset the vehicle type to be a train and adjust cost and operating numbers as needed.
- Ship or barge routes that travel up and down a river or canal or across a lake or an ocean are initially drawn as a straight line drawn between the originating facility and the destination facility. You will see small white globes placed at intervals along the route line. Drag and drop those small white globes as needed to make the route line segments better follow the actual path of the river or canal. When you model the route of a ship across the ocean you do the same to guide the route around land and keep it on water.
- Airplane routes for flying between origin and destination facilities are drawn as straight lines. As with ship routes, there are white globes displayed along the length of the route and you can drag and drop those globes to move route segments so as to route around closed airspace or make any other airplane route adjustments you wish.
- Truck routes across water or land where there are no roads will also be drawn as a straight line with small white globes to drag and drop to adjust route segments to follow a proposed route. You can explore what would happen if trucks could travel such a route (perhaps you are proposing an underwater tunnel or a new bridge or road etc). People can easily see that no roads currently exist on the route you have drawn so it is up to you to explain your reasons.
SCM Globe allows you to designate any route to be a rail or a ship route even if there is no rail or waterway on the route because you may wish to explore the effect of a rail or water route to that destination. It is up to you to be realistic. People can easily zoom in on the map and see for themselves if a route is really what you designate it to be. If you decide to have a train travel a route where there is no rail, or a ship travel a route where there is no water it is up to you to explain why.
Replenish product safety stock at facilities by setting product drop quantities on routes that service those facilities to be slightly higher than product demand. This practice of replenishing safety stock produces a saw-tooth pattern in the on-hand inventory graphs for products at facilities. That is because on-hand inventory starts to build up and then gets drawn down again when a missed delivery occurs and the accumulated safety stock is consumed to cover that missed delivery (learn more about interpreting patterns produced by on-hand inventory graphs in “Analyzing Simulation Data“).
Optimize the quantity of a product to deliver to a facility by using the Economic Order Quantity (EOQ). EOQ is a formula to estimate the best quantity of a product to order and how often to order given the demand for the product at a facility. Set product delivery amounts (drop qty) at facilities to the EOQ amounts for the product at that facility (the EOQ amount is what a facility should order in an efficient supply chain). Divide the EOQ delivery quantity by daily demand for the product to estimate how often deliveries should be made. There is a complete explanation and example of how to use data available in SCM Globe supply chain models to calculate EOQ quantities – see the section “Lowering Inventory and Operating Costs” — scroll down to the heading “Use Economic Order Quantity (EOQ) for Delivery Amounts and Frequencies”
Product Deliveries on Routes: Product deliveries on routes where vehicle Delay Between Departures + Route Travel Time = 4 hours or less are undercounted at an increasing rate (10 to 40 percent) as the total time drops below 0.5 hours.
- WORKAROUND – Increase the delay between departures for a vehicle so that route travel time plus delay between departures is equal to four hours or more.
- WORKAROUND – If you want to model and simulate supply chains where delay between departure plus route time is 4 hours or less, then shrink the simulation timeline to make a day equal half a day or one quarter of a day. See more in “Tips for Building Supply Chain Models” – scroll down on the page to the major heading “Vehicles“, begin reading the paragraph starting with “A Limitation in Vehicle Modeling Logic…” Also see major heading “Simulation Timeline” for an explanation of scaling the timeline.
Products can be picked up and dropped off at facilities. For each stop on a delivery route you can both drop off and pick up products.
- For instance, a vehicle may drop off X units of product A at a stop and pick up Y units of any other product at the facility where the stop is made.
- In this way you can model delivery routes where vehicles deliver all the products they carry to the stops on their route and return to their start location empty, or they can just deliver a portion of their products and pick up other products at the facilities where they make stops.
- Products in a vehicle when it returns from traveling its route will be added to the on-hand amounts for those products at the facility where the vehicle is based.
- The software will check to make sure you do not pickup or drop off more products than a vehicle can carry.
- Remember, you can increase or decrease frequencies of product deliveries and pickups by changing the delay between departures for the vehicle assigned to a product delivery route.
LIMITATION in Route Modeling Logic: The logic used when building routes is to check the total drop quantities on a route and make sure that total number does not exceed the carry volume or the max weight for the vehicle on that route. This logic accounts for dropping off products at facilities and freeing up space to pick up other products. However, there is a use case where this logic does not work.
- Example Use Case: A vehicle with a carry volume of 75 m3 starts out from its originating facility loaded with 75 product items each with a volume of 1 m3. At other facilities along the route the vehicle drops off these 75 items. It then has space to pick up 75 more items at another facility on the route. It does this with no problem. But if you try to drop off any of those items at another facility before the vehicle returns to its originating facility, there will be a problem. An error message will appear saying you have overloaded the vehicle. That’s because the total drop quantities are larger than the carry volume of the vehicle.
- WORKAROUND: Increase the carry volume (as highlighted in the Edit: Vehicle box below) or max weight of the vehicle to accommodate the extra drop quantity. As shown below, the train starts out from the Seasonings DC (originating facility), and it is loaded with the total amount of products that will be dropped off at all stops along the route. So it will be loaded with the extra 25 cubes to be dropped off at Ft Wayne, even though that does not model exactly what you want to do (as highlighted in the Edit: Route box).

- Nonetheless, it still drops off the planned quantities at Louisville (25) and Indianapolis (50). And it picks up the planned quantity in Chicago (75), and drops off the 25 items in Ft Wayne. The product items still left on the vehicle get delivered to the originating facility – the Seasonings DC. So, 75 items get delivered to the Seasonings DC when only 50 should have been delivered. But at the start of the route an extra 25 items were pulled from the DC inventory and put on the train. At the end of the route when the simulation nets out that 25 against the 75 items delivered, it shows the correct increase of 50 items each time the route is completed. Thus the simulation data is accurate when used to generate cost and performance reports.

Pick supply chain boundaries that best fit the needs of a project. For instance, we may decide that for our analysis a supply chain model will start with a certain factory even though that factory is supplied with raw material or component parts by other factories (the Cincinnati Seasonings supply chain is an example of this). We can just model the products produced by the factory and not worry about what was supplied to the factory to make those products. We just add the daily cost of purchasing products from suppliers to the daily operating cost for that factory.
If we are creating a more detailed model of a section of a supply chain, we may begin with a warehouse that receives products from sources outside the model. In that case, just define a daily production rate for those products at the warehouse. This models the daily delivery of those products to the warehouse without having to show where they came from. The price assigned to those products will also be recorded as an expense in the simulation data. Read more about the level of precision and the margin of error in supply chain models and simulations in All Supply Chain Models are Approximations.
When modeling sections of a supply chain we may be interested only in the part that connects factories and warehouses and not wish to show stores where the products are ultimately delivered. We can handle this by placing demand for those products at a warehouse. In this way we model the daily consumption of products without having to show where they were delivered.
When the model does include the stores that a warehouse makes deliveries to, then do not define any daily demand for products at the warehouse. Inventory levels will be reflected by the daily deliveries of products to the warehouse and shipments from that warehouse on routes starting at that warehouse. Those deliveries and shipments will determine on-hand amounts at the warehouse. If demand numbers for those products were entered at the warehouse, it would result in a double counting of the actual demand.

The time unit used by SCM Globe simulations is the hour. The simulation engine calculates the state of each entity in the supply chain in hourly snapshots. And the results are aggregated into 24-hour days for display on screen and in downloaded simulation data. If you want to model and simulate periods longer than 30 – 60 days, you can expand the scale of the timeline. In your model one day could represent two days, or a week, or a month instead of just one day. To use this technique, adjust your model so that daily operating costs become two-day, or weekly or monthly costs. Set production and demand rates equal to two-day, weekly or monthly rates as well. And vehicle speeds also increase by a factor equal to the number of days represented by a single day in your model. For example, if you want one day to equal a week (7 days), then multiply vehicle speeds by 7, and divide vehicle times between departure by 7. See the Ancient Silk Road case study for an example of expanding the timeline to get a longer term view of supply chain operations.
The reverse will also work. You can shrink the timeline and make one day of a simulation equal half a day (12 hrs), or a quarter day (6 hrs), down to one hour. To do this you decrease demand and production rates, plus daily costs and vehicle speeds accordingly. For instance, if you want to model a supply chain in half day increments then then divide vehicle speeds by 2, and multiply the vehicle time between departure by 2. Also divide production, demand and cost numbers by 2. To model in quarter day increments, divide these numbers by 4, and multiply times between departure by 4. See the Disaster Response Supply Chains – Flooding Scenario case study for an example of shrinking the simulation timeline to get more short term hourly detail (scroll down to “SECOND CHALLENGE – An Unexpected Event Calls for Surge Capacity”).
Simulations are typically focused on 30-day periods, not 6-month or annual periods. This is because most companies operate on a 30-day sales and operations planning (S&OP) cycle. In the S&OP process companies forecast product demand for a 30-day period because 30-day forecasts are inherently more accurate than 90-day or 1-year forecasts. High rates of change and unpredictable events in the global economy make it difficult to create accurate forecasts for periods beyond 30 days. This means companies navigate their way through an uncertain world by using 30-day forecast and planning windows.
You may wish to simulate an entire year by using a sequence of 30-day or 90-day simulations that cover a 12 month period. Do that by setting the production and demand levels in each monthly or quarterly simulation equal to what you expect those levels to be at that time of year. Set daily demand higher in times of expected higher demand and set daily demand lower in times of expected lower demand. To simulate unexpected disruptions at given times in a year or month, pick a month and run simulations with different levels of demand or production or product on-hand amounts at certain facilities and see what happens.
For instance, if you are simulating a supply chain to handle gardening products, you know demand will be higher in summer months and lower in winter months. To see how such a supply chain performs at different times of the year, set product demand at facilities to be what you expect in a typical summer month. To see how the supply performs in winter months, set product demand at facilities to expected winter levels. Or set product demand levels higher than expected for a winter month and see what happens. Adjustments each month to entities in the supply chain (products, facilities, vehicles and routes) are needed to make the supply chain run well in a high demand period versus a low demand period.


Once you create or update a supply chain model, you bring in the SCM Globe simulation engine to drive that model and see how well it performs. There are some initial calculations made by the simulation engine that affect beginning amounts of on-hand inventory for some products at some facilities. These initial calculations create the “Day 0” starting point for the supply chain at the beginning of a simulation:
- On Day 0 the facilities that have daily demand for a product have that daily demand amount subtracted from their on-hand inventory of that product.
- Vehicles leave their facilities on Day 0 with their delivery quantities which are subtracted from on-hand inventory amounts at the facility.
- If there are routes originating at a facility where products are picked up from other facilities and returned to the that facility, then the amount(s) of picked up product(s) are added to on-hand inventory at that facility.
- Monthly fixed operating costs are assigned to each vehicle at each facility.
These adjustments on Day 0 reflect the fact that, in most cases, supply chains are on-going operations that are already in motion. This means the supply chain model must make a running start into the simulation and not simply act as if all operations began on day one of the simulation. These running start adjustments do not change the overall supply chain patterns, trends or performance levels shown in the simulations. Most of the time in most supply chain models it is not worth worrying about these things.
However, in some cases you may wish to compensate for these Day 0 calculations. You can do this by adding an extra day’s amount of on-hand inventory for product demand at affected facilities. And you can subtract pickup amounts from on-hand amounts of products at affected facilities. For vehicles, you can reduce operating cost per km on selected vehicles by 25% or some other appropriate percentage. Also if you wish, you can remove the row of Day 0 data from the downloaded simulation data, and use Day 1 to Day 31 for your P&L and KPIs report.
When using a vehicle for a one-time delivery or pickup of products in your simulation you need to make the following adjustments to compensate for Day 0 calculations:
- At the facility where products are stocked the one-time vehicle is loaded with products equal to its delivery amounts and it departs on its route. It delivers products to receiving facility(s) and returns to the stocking facility. At the stocking facility the vehicle is then loaded with products again even though it never departs on its route. It is loaded again with the same amount as it first delivered to the receiving facility. To compensate for this double counting, add additional inventory equal to the delivery amount to the amount on-hand .
- When the one-time vehicle is based at the stocking facility, there is no need to adjust on-hand product amounts at the facility receiving the one-time delivery.
- If the one-time vehicle starts at the receiving facility and goes to the stocking facility to pick up products and bring them back, the Day 0 calculations cause the amount delivered to be counted twice. Day 0 automatically adds inventory amounts that are scheduled to be delivered from other facilities. Then the vehicle departs and picks up that same amount at the stocking location and delivers it back to the receiving facility. To compensate, reduce the on-hand product quantities by an amount equal to the one-time delivery amounts.
- When the one-time vehicle is based at the receiving facility, there is no need to adjust on-hand product amounts at the stocking facility.

Supply chain modeling & simulation, training, optimization, and risk assessment services are available through us and our consulting partners. We can work with you online or in person. Find out more by inquiring at info@scmglobe.com
SAVE BACKUP COPIES of your supply chain model from time to time as you make changes. There is no “undo”, but if a change doesn’t work out, you can restore from a saved copy. Also, sometimes supply chain model files (json files) become damaged and they no longer work. So you want backup copies of your supply chain to restore from when that happens.