


The SCM Globe simulation engine uses discrete event simulation (DES) with a deterministic, non-linear model. We apply DES using the fixed-increment time progression method. Time in the simulations is broken into time increments of one to sixty minutes, and the supply chain system state is then updated according to the events happening within each time increment. Our simulations combine DES with agent-based modeling. The model agents are instances of the four entity classes explained below (Products, Facilities, Vehicles, and Routes).
This enables our simulations to show both the overall state of an entire supply chain network, and the state of each individual entity moment by moment as a scenario plays out. The simulations show real-time animation of vehicle movements on their routes, plus graphic and numeric displays showing the status of facilities and products as the scenario progresses. Simulations can be speeded up, slowed down, paused, and re-started as needed to investigate specific developments. Simulation data is saved and can be downloaded for further analysis and reporting purposes (see Analyzing Simulation Data).
Add probability to our deterministic forecasts by running multiple simulations with small changes in initial attribute values for facilities, vehicles, and routes. These simulations generate an ensemble, or body of results, to use for calculating probabilities for given events occurring at certain facilities and times. This is the same technique used to add probabilistic features to weather forecasts created by deterministic weather models.
Flow of Products Through a Network of Facilities
SCM Globe tracks the flow of products through a network of facilities (a supply chain), and calculates related operating costs and key performance indicators (KPIs) over any number of hours, days, weeks or months. Supply chains and operations can be modeled and simulated at any level from global to regional and local. Simulations display the results of interactions between model agents in the FOUR ENTITY CLASSES:

1) Products – things in demand at various facilities
2) Facilities – places where products are made, stored, sold or consumed
3) Vehicles – mechanisms to move products between facilities to meet demand
4) Routes – paths taken by vehicles to move products between facilities
There is also a fifth entity built into this model; that entity is Time. Facilities have attributes such as product demand and operating costs that are expressed as a rate over some period of time from hours to days, weeks, or months. Vehicles have attributes such as speed and operating cost that are expressed as distance divided by time. And routes have travel times for the vehicles that travel them based on the length of the route and the speed of the vehicle.
Place Entity Icons on Digital Map to Define Network
Entities in these four classes are defined with small data sets, typically four to six attributes for each entity. When entities are defined, the resulting entity icons are dragged and dropped to position them on a digital map (such as Google Maps). Zoom in on the map, switch to satellite view, and place entities where they are actually located in real supply chains, or where you want them to be in new supply chains. Once these entities are placed on the map they create a mathematically rigorous model that is used by the simulation engine (but you don’t have to deal directly with the math).

[ We are glad to provide a free evaluation account to instructors, students and supply chain professionals interested in exploring SCM Globe simulations — click here to request an account — Get Your Free Trial Demo ]
SCM Globe simulations exhibit what is known as “deterministic chaos.” This is because simulation results are highly sensitive to initial starting conditions as defined in each individual supply chain model. Small changes to a model can produce results that may appear counter-intuitive, unpredictable, or even chaotic… just like the real world (see “Butterfly Effect“). There are endless changes and combinations of changes you can make to the different entities in your supply chain model. And each time you make a change, your simulation takes a unique trajectory determined by the cumulative effect of all the changes you have made up to that point.
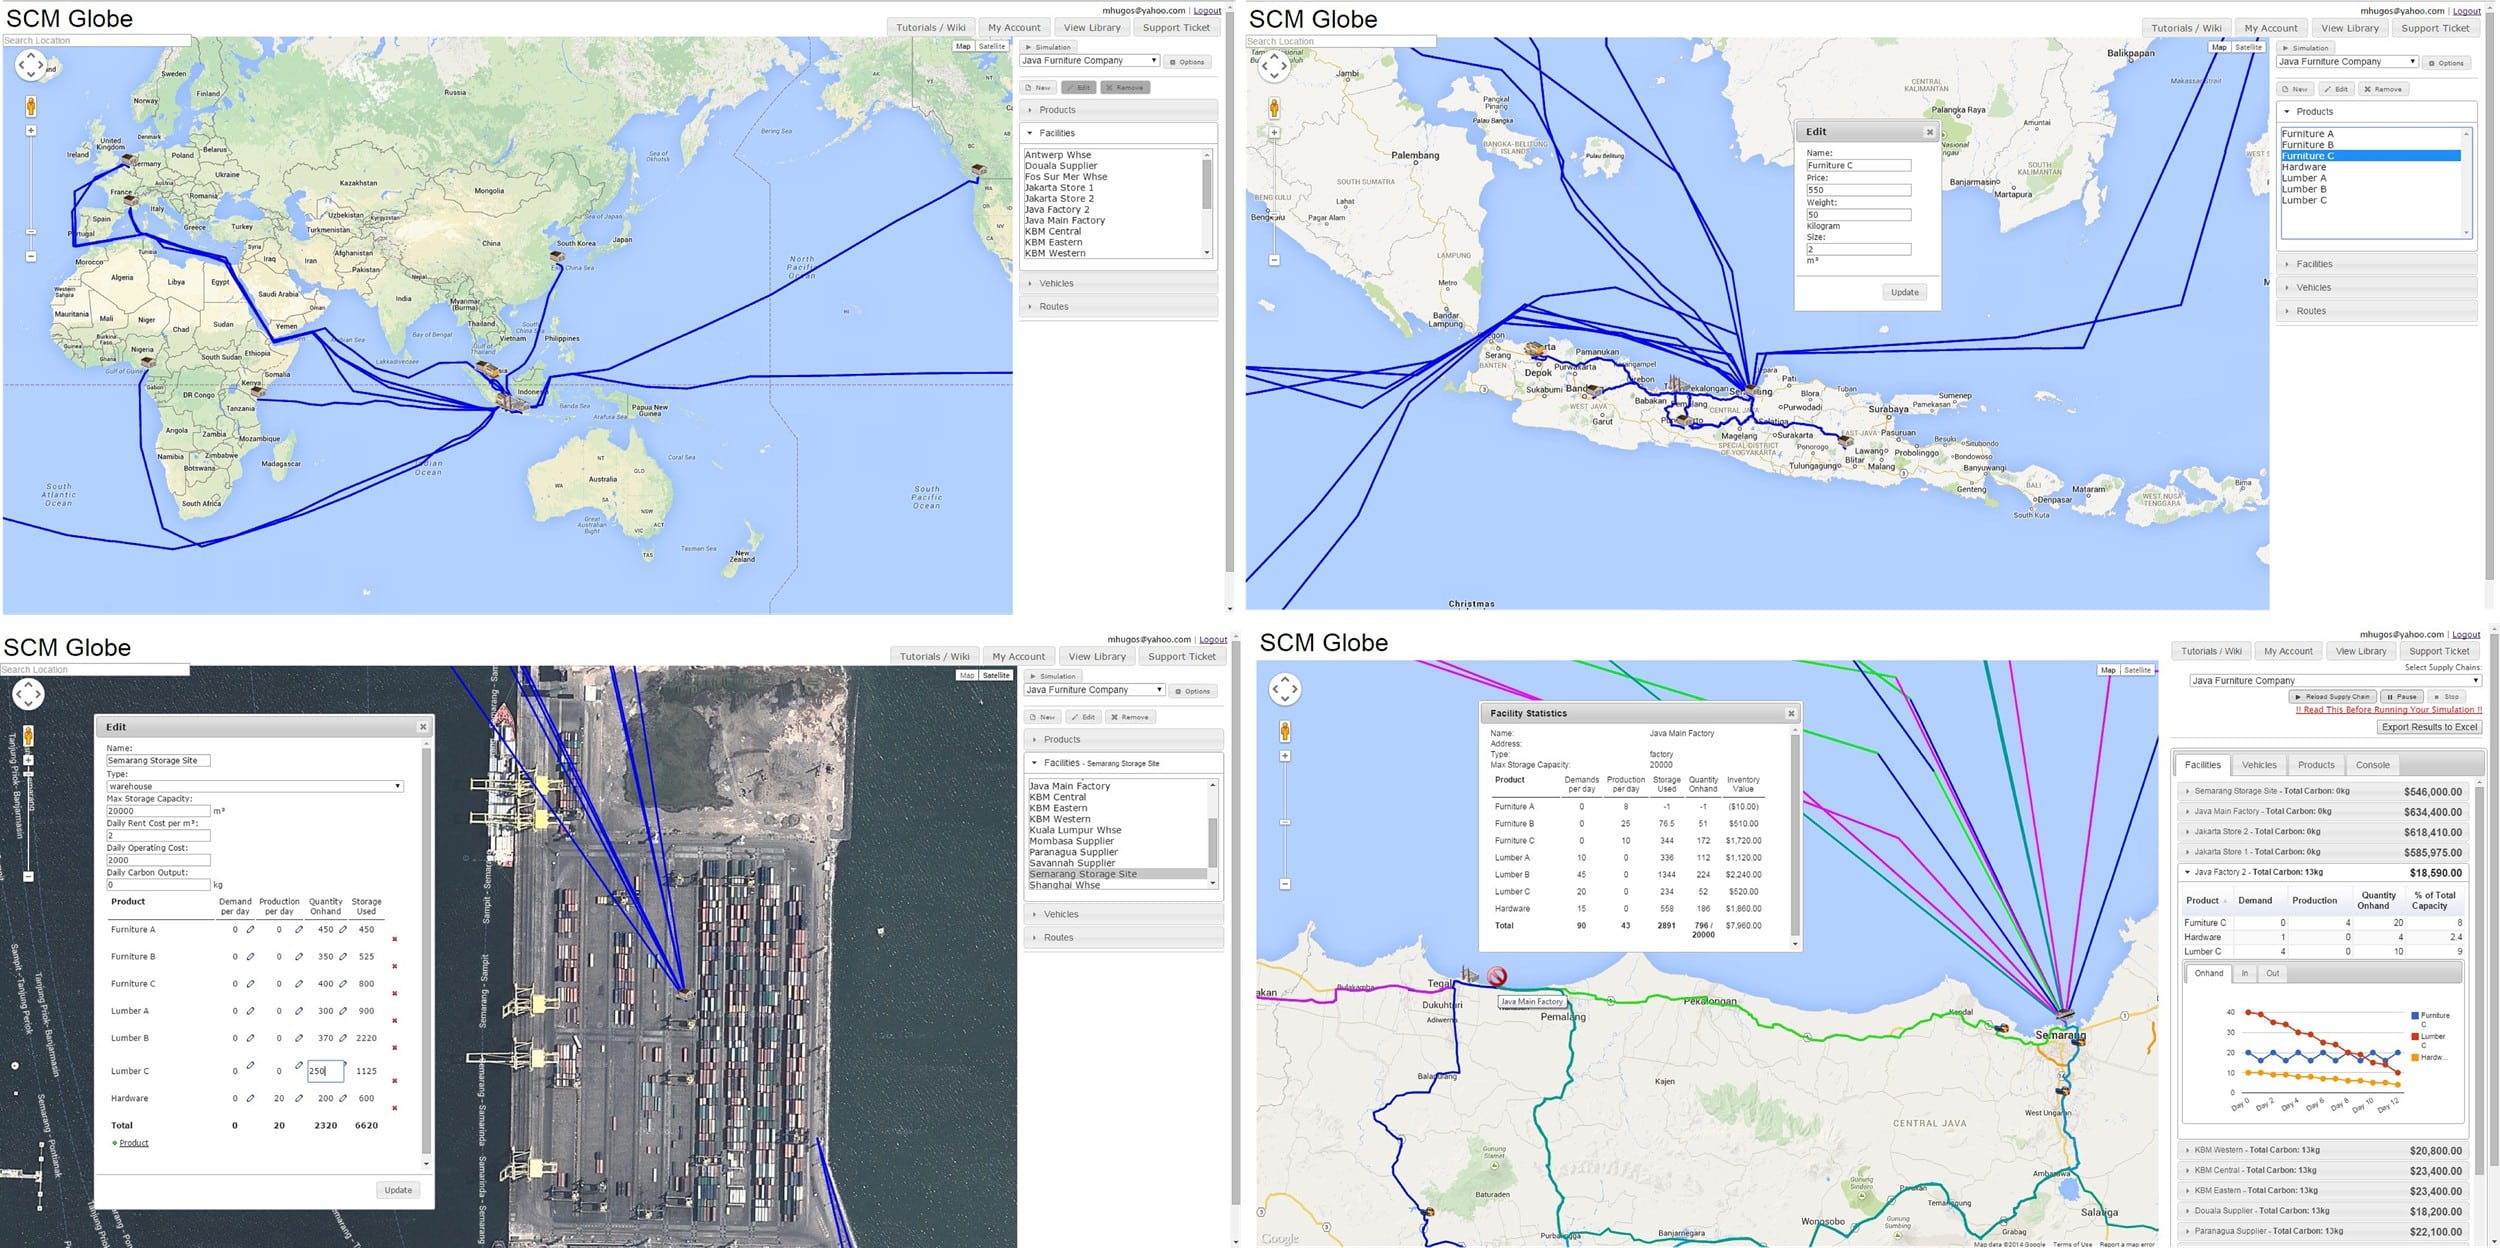
The application employs a map-based user interface to present essential supply chain activities and information in an easily understandable visual format. Maps and satellite views as shown below provide an organizing context for displaying supply chain structure and detailed performance data generated by the simulations. This reduces the amount of training needed to set up and run the simulations making them understandable and usable by a wide business, professional and academic audience (not just a small group of experts).
.
Useful Models
There’s a saying in the statistics profession, “All models are wrong, but some are useful.” This saying is attributed to the distinguished British statistician George Box. What he meant is all models must be summaries or approximations of reality, and because they are approximations, they are wrong to some degree. Builders of models must select key variables that capture the essence of a situation because it is not possible to include all the different variables that exist, and address all their possible interactions. In a paper published in the Journal of the American Statistical Association, Box said, “Since all models are wrong the scientist cannot obtain a ‘correct’ one by excessive elaboration. On the contrary, following William of Occam, he should seek an economical description of natural phenomena. Just as the ability to devise simple but evocative models is the signature of the great scientist, so over elaboration and over parameterization is often the mark of mediocrity.” ( Box, G. E. P. (1976), “Science and Statistics” (PDF), Journal of the American Statistical Association, Vol. 71: pg. 791–799)
![]()
A map is another example of a model that summarizes reality. To contain all the detail of the real world a map would have to be as big as the world itself. So maps leave out a lot of detail, yet many are still quite useful.
Mathematical Model Combined with a Digital Map
To make SCM Globe usable by a wide audience, we summarize and simplify certain aspects of supply chain modeling and simulation. We leave out some supply chain detail and complexity, yet SCM Globe accurately models the essential operations of any supply chain. And running those models in simulations show the performance of whatever supply chain you wish to explore. We combine a useful mathematical model (defined by the four entities) with a digital map (such as Google Maps) to clearly illustrate how any supply chain anywhere in the world is structured and how it works.
Listed below are links to pages in this guide to learn more about techniques and best practices for building models, and using simulations to explore options and solve problems:
- Tips for Building Supply Chain Models
- All Supply Chain Models are Approximations
- Adjusting Rate of Missed Deliveries
- The Butterfly Effect
- Analyzing Simulation Data
- Cutting Inventory and Operating Costs
- Supply Chain Optimization & Reporting Template
- Balancing Supply Chain Risk and Performance
- Modeling and Simulation Services
.
Supply Chain Simulation and Operations Planning
The diagram below shows current features of SCM Globe Pro. Data for supply chain models can be entered manually, or automatically imported from other data sources such as ERP systems, or geospatial databases. Supply chain models are displayed and edited in the Edit screen. And models are run in simulations in the Simulate screen. Simulation results can be run through AI and optimizing algorithms to find areas where changes can be made to the supply chain model to improve performance. See more about the present optimizing capabilities in “Supply Chain Optimization & Reporting Template”
Model real supply chains and use simulations plus AI and optimizing algorithms to improve those models. The models that run best in simulations can then be converted into operating plans and schedules for facilities and vehicles in the actual supply chains they represent. In addition, the simulations provide forecasted (or planned) operating costs, and key performance indicators (KPIs) which provide a baseline to compare against actual operating costs and KPIs for those supply chains.

** IF YOU PURCHASE the BUSINESS EDITION: SCM GLOBE PRO — Please contact us (info@scmglobe.com) to activate the data import/export features, and the automatic modeling and reporting features of SCM GLOBE PRO. You can also schedule your one hour training session included with SCM GLOBE PRO.
SIMULATION and OPTIMIZATION are Different Things
People are often confused about the meaning of “simulation” and “optimization”. SCM Globe runs simulations, and the simulations generate data that can be used for optimizations.
- SIMULATION allows you to model any existing supply chain or a proposed new supply chain and see how it works. It shows how different designs will operate, and what their costs and performance levels will be.
- OPTIMIZATION allows you to take a single supply chain design and optimize specific variables in order to obtain the best possible performance from that design. Optimizations refine existing designs, but optimizations do not create new designs.
When people say “supply chain simulation” sometimes what they are referring to is optimizing the layout or operations of a single facility such as a warehouse or a factory. Doing optimizations like this involves loading lots of detailed data into a software application that uses sophisticated linear programming algorithms to crunch through the data and calculate optimal answers. This is good of course, but it is important to remember that although a single facility may be part of a supply chain, a single facility is not a supply chain. And optimizing the performance of a single facility does not optimize performance of an entire supply chain (this is well documented in the Theory of Constraints).
SCM Globe models and simulates entire supply chains, not just single facilities. This enables you to explore ways to improve the overall performance of extended supply chain networks, and not just optimize the operations of a single factory or distribution center.

The simulations produce lots of data that can be downloaded and there are reporting templates that use downloaded simulation data to create Profit & Loss Reports plus key performance indicators (KPIs). Find out more about this in Analyzing Simulation Data – scroll down to the heading titled “Download Simulation Data to Spreadsheet Reporting Templates“.
The Advanced Version of the reporting template includes performance dashboards that show where the biggest opportunities are to optimize your supply chain design. You can also run your simulation data through other optimizing templates such as the capacitated plant location model (CAPLOC), or the delivery route optimization model. Learn more here – Supply Chain Optimization & Reporting Template
Simulations let you try out ideas and see what works best in different situations. As the road ahead twists and turns in unexpected ways, keep updating your model and running simulations. What works best in the simulations will also work best in the real world. In a volatile, uncertain, complex, and ambiguous (VUCA) world you will find which courses of action (COAs) work best to get you where you want to go.

Use simulations like radar to probe through the fog of uncertainty

NOTE: These limitations apply only to Academic and Professional versions. The Enterprise version does not have these limitations and is designed for multi-user, real-time supply chain planning, operations scheduling, and monitoring.
Academic and Professional versions use a one hour time progression increment in the simulations. This causes events taking less than 1 hour to sometimes be missed, and events taking four hours or less can be distorted due to rounding errors related to the one hour progression increment. The Enterprise version uses a one minute time progression increment combined with higher definition supply chain models to resolve the problems described below.
Travel times for vehicles are rounded up or down to the nearest whole hour even though actual travel times may be fractions of hours. This affects calculations for vehicle operating cost and carbon generation. Vehicle Event Time = Delay Between Departures + Route Travel Time. For vehicles events that are four hours or less rounding errors increase as event times decrease, starting from 5 – 10% and going as high as 40%. For vehicle events greater than four hours rounding errors decrease as route travel times increase. Rounding errors also decrease over longer simulation periods (15 days or more). Due to these rounding errors, there are specific situations to be aware of:
- Adding a stop on a multi-stop route where it takes less than 1.5 hours for a vehicle to move between the added stop and the previous or next stop will cause vehicle operating costs and carbon to be under counted by 20 to 40 percent as travel time decreases.
- Single-stop routes where the route travel time is 1.5 hours or less will show vehicle operating costs and carbon generation that is over counted by 20 to 80 percent as travel time decreases.
- Facilities this close together can be modeled as a single facility that combines the attributes of the closely grouped facilities. (The new Enterprise Edition of SCM Globe will use a one minute progression increment to solve this rounding problem.)
Product deliveries on short routes taking less than one hour can be missed if their start or stop times fall in between the hourly progression increments. For modeling such short term activities, it is best to use the time compression method where one hour becomes 30 minutes or 15 minutes. See “Tips for Building Supply Chain Models” and scroll down to “Simulation Timeline” to learn more.
Limitations due to the software model and systems architecture used by SCM Globe are listed in the FAQs section of this guide, along with suggestions for managing those limitations. Go to the FAQs page and scroll down to the heading “Software Limitations” to see more about these limitations.

Advanced supply chain modeling, simulation, optimization, and risk assessment services are available through us and our consulting partners. We can work with you online or in person. See more in SCM Globe Services.
NOTE: The academic version of SCM Globe supports supply chain models containing up to 15 – 20 products and a similar number of facilities, vehicles and routes. Models exceeding these limits will run slowly and experience other problems. See “Tips for Building Supply Chain Models” for further explanation and ways to work with these limits.
[DISCLAIMER: Developers and users of SCM Globe have run thousands of different simulations and analyzed the results thousands of times since release of version 1.0 of the simulation engine in the fall of 2011. In that original version and succeeding versions, bugs were found and fixed, and the accuracy of certain calculations was improved. In this current version (Ver 2.7, in production since October 2013) there are several known bugs in editing and displaying supply chain data and they are listed in the FAQs. But no bugs have been found in the actual supply chain simulations, even as usage has increased significantly. If you do find a bug please contact us immediately, and send the simulation data that reflects this bug. Be sure to read the FAQs section to see why deliveries are sometimes missed, and understand the “Day 0” calculations used to start all simulations.]