


CASE STUDY CONCEPT: Sales & Operations Planning (S&OP) with simulations for business growth and supply chain risk management.
You connect your laptop to the boardroom projector, and the company’s supply chain appears on the big screen at the front of the room. People stop talking and turn to look at what you are showing them. What they see is the company’s supply chain drawn on a map of the world.
[This case is based on work with a real company; company names and numbers have been changed for use in the model and simulation presented here. ]
The supply chain model you show them is composed of products, facilities, vehicles and routes that you defined and placed on the map. With a few mouse clicks you call up information about these entities in dialog boxes where data can be reviewed and changed (data for one of the product categories is shown in the screenshot below).

(click on screenshot to see larger image)
“Java Furniture Company” is the largest business unit of a European furniture maker; company management is located partly in Europe and partly in Indonesia. The company makes stylish, high quality furniture from sustainably harvested teak and other exotic hardwoods. Its two furniture factories are located in Indonesia on the island of Java, and it sells to customers around the world.
PART 1 — The “AS IS” Supply Chain
PART 1 of this case study models the existing structure and operations of the Java Furniture Company supply chain (the AS IS Supply Chain). Simulations are used to find ways to increase the volume of products handled, and improve the operating performance of this existing supply chain.
[NOTE: This is an advanced case. Work through the three challenges of the beginning case, “Cincinnati Seasonings” before taking on the challenges in this case.]
The company has assembled a supply chain task force composed of people from different geographical areas and responsibilities – operations, purchasing, sales, and finance. The task force members have traveled to meet in person at company headquarters in Brussels to start the project. After this first round of meetings, task force members will return to their respective locations and meet in weekly online supply chain design sessions. Your job is to guide them through a process of analyzing different options, and help make decisions about how to create a supply chain to support the next level of company growth.
From what you’ve heard in individual conversations over the last few days, you realize different groups in the company are fixating on different parts of the supply chain, and pressing for their own interests without understanding the overall effects of different courses of action. The finance people in Europe are focusing on how to increase productivity at the two factories in Indonesia. Operations people in Indonesia argue that the most important issue is to improve movement of products between the factory and the port where they are loaded onto cargo ships for delivery to customers. Purchasing people want to know if they should line up new suppliers or shippers. And sales managers in Europe and Indonesia just want to do whatever it takes to increase production and support rising worldwide sales.
Providing a Common Big-Picture Understanding of the Company Supply Chain
You want people on the task force to see and understand how the different parts of the supply chain interact, and how changes in one part can affect the other parts. With that common understanding, people can collaborate to solve problems instead of just arguing and bargaining with each other. Good solutions to big problems can be found when people collaborate effectively.
You begin your remarks by pointing out that the factories and the port in Indonesia lie at the center of a global supply chain that spans four continents. Then, zooming in on the map, you show more detail of the supply chain on the island of Java.
People see the routes that connect the factory with the port and the sources of teak wood on the island. They also see the two company stores in Jakarta, and from the port they see the shipping routes that deliver the company’s products to customers.

[NOTE: This is an advanced case. Work through the three online challenges of the beginning case, “Cincinnati Seasonings” before working with this case. We are glad to provide a free evaluation account to instructors and supply chain professionals interested in exploring SCM Globe simulations — click here to request an account — Free Trial Demo Account ]
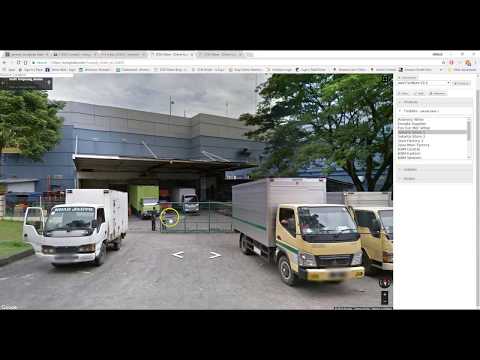
You zoom all the way in to the port of Semarang and switch on the satellite view so people can see for themselves what this facility looks like, and see the amount of traffic that flows through it. With this picture of the port onscreen, you pull up a dialog box showing relevant information about the port and the company’s products in the container storage yard there.

(click on screenshot to see larger image)
Using information you gathered in your initial research and conversations before the meeting, you created a first version model of the company’s global supply chain. You made some simplifying assumptions, and employed some techniques to model the essentials of the company’s supply chain (see footnotes at end of this case study). The numbers used in the model can always be adjusted as you learn more, and other changes and additions can easily be made to the model as the project progresses. During the project you and the task force members will focus on improving the accuracy of the model, and using it to explore different supply chain design options for supporting company growth.
Running the First Simulation of the Existing Supply Chain
After reviewing various parts of the supply chain, you run a simulation to show people how this present supply chain operates. People watch the big screen as the simulation plays out. They see what happens. On day 27 the big showroom store in Singapore runs out of Furniture C. This is the category of larger and more profitable products that is experiencing the biggest sales growth. This simulation result gets people talking about the supply chain adjustments needed to support sales in Singapore and elsewhere.

You explain that a supply chain requires coordination between all the different parties and facilities. The better the coordination, the smoother the flow of products through the supply chain. The goal is for customers to get the products they want when they want them, and at the same time to enable manufacturers and distributors to maintain their profits by keeping their on-hand inventory and related storage and transportation costs as low as possible.
In looking through the simulation data, you can see what it says about how inventory flows through the company supply chain. You ask the task force members to imagine a supply chain as a network of pipes and reservoirs. Pipes are the product delivery routes and reservoirs are the warehouses. Think of inventory flowing through a supply chain as if it was water flowing through pipes and reservoirs to meet the demands of people when they want water. The water must flow smoothly and be available immediately when a person turns on the faucet, so you keep the reservoirs filled with enough water to meet demands. But you don’t want reservoirs to fill up with too much water because then the water would overflow and be wasted.
See How Products Flow through the Existing Supply Chain
The diagram below is created from the on-hand inventory graph displays for key facilities in the Java Furniture Company supply chain. When you click on a facility in the simulation, you can see its inventory graph. Suppliers of raw materials are shown on the left and bottom of the diagram, the Semarang Port and Main Factory are shown in the middle, and customers are shown on the right side. Grey arrows indicate the direction of inventory flow in the supply chain.

When you look at these graphs you watch for a few simple yet critical characteristics:
- Upward sloping lines mean more product is being delivered or manufactured than is demanded
- Downward sloping lines mean more product is being demanded than delivered
- Saw tooth patterns indicate deliveries happening every few days — on-hand product is drawn down by daily demand and then spikes up when deliveries are made
- Stair step patterns indicate missed deliveries that eat into safety stock
- (see more about this in online guide section “Analyzing Simulation Data“)
As you scan these inventory graphs you point out several things to the group:
- Downward sloping lines at the port show a need to import more raw material and deliver more finished product from the factory for shipping to customers.
- Relatively flat lines for on-hand inventory at the factory show supplies are pretty well balanced with demand for the current factory production levels.
- Two upward sloping lines at the factory attract your attention.
- The red line is Furniture B; while it’s rising at the factory, you see it’s dropping at the port. Need to ship more Furniture B from the factory to the port.
- The yellow line at the factory is Furniture C, and it too is going up while at the port it is dropping.
- The purple line at the factory, while fairly flat, is much higher than currently needed. It shows on-hand inventory for Lumber B which is needed to make Furniture B. But if the company plans to increase production of this product category it may need all that inventory and perhaps even more
Now you pose some questions to the group. You ask them what they think would happen if this existing supply chain tries to support sales increases of 20 to 40 percent. This generates a lively discussion with people offering different opinions about what would happen and why. Listening to this exchange of opinions, you realize that until people on the task force have a common understanding of the company’s supply chain, they will just continue arguing among themselves.
Modeling Different Supply Chain Scenarios
So you suggest the following approach as a way to model the sales increase and simulate what happens. You start by looking at the demand and production numbers at the factory as shown in the dialog box below. It shows how much of each type of lumber is needed to produce given amounts of the three product lines.

Three categories of lumber – A, B, and C are used to produce three lines of furniture – A, B and C. Lumber A is used to produce Furniture A; Lumber B is used to produce Furniture B; and Lumber C is used for Furniture C. By looking at the numbers you can see it takes 10 cases of Lumber A to produce 13 cases of Furniture A (case sizes and weights are different for lumber and furniture). You also see the same information for Furniture B and C.
Each line of furniture also needs hardware (hinges, bolts, screws, handles, etc.) as well as lumber and you can see the daily demand for hardware is 15 cases for 41 cases of all furniture lines. Assume the hardware is used equally by all lines of furniture, so each case of furniture requires about a third of a case of hardware. Use these ratios as you plan for increased production at the factory. Use these ratios to construct several scenarios that model different supply chain options you want to explore.
Simulations Create the Common Understanding Needed for Effective Planning
To answer the question of what supply chain changes will be needed to support 20 and 40 percent sales increases, you put some new numbers into the supply chain model. You increase the daily lumber and hardware demand numbers, as well as the daily product production numbers at the factory. You increase the numbers for Furniture A and B by 20 percent, and increase the Furniture C numbers by 40 percent.
You also increase demand numbers for the product categories at the two stores in Jakarta and the wholesale warehouses that products are delivered to in other cities. Not all stores and warehouses will have the same percentage increase in product demand. You assign different percentage increases based on your market research (use simple measures like sales history and average income in cities where stores and warehouses are located – higher current sales and higher incomes mean higher future sales). The overall increase in Furniture C unit sales will be a 40 percent increase from current total sales, and the overall unit sales of Furniture A and Furniture B will be up 20 percent from current levels.
Then you run a simulation. People see for themselves where inventory runs out and where too much inventory builds up. They can also see causes for these problems and people start suggesting adjustments to the supply chain design to address them. You guide the group to discuss some different ideas and their effects on the supply chain design. Then you model a couple of those designs and simulate them so everyone can see what happens.
As more products start moving through the supply chain everyone sees the cost of transportation rise. This frames a conversation about the relationship between transport costs and production levels. In particular, you guide people to consider the increased trucking costs required to move additional products between the main factory and the port. Then you pose the question, “Do we have other transportation options beyond trucks and what are their costs?”
It also becomes clear to everyone that movement of products between the factory and the port, and the rate at which products can be loaded onto arriving container ships is a critical issue to be addressed. Disruptions at the port of Semarang could quickly become a crippling bottleneck that would slow down the entire supply chain. Even if the factory does produce more furniture, it is pointless unless that additional furniture can be delivered to customers in a timely manner. People see this quite clearly in the simulations. It becomes obvious to everyone that the new supply chain the company needs has to take into account the concerns and desires of different groups within the company.
BEST PRACTICE: Sales & Operations Planning (S&OP)
S&OP is a supply chain best practice used by companies to continuously collect, combine, and act on information from different areas within a company. S&OP provides a guiding framework for company decision-making and helps deliver better customer service, lower on-hand inventory, and improved efficiency in production, procurement and transportation operations. Here are two good definitions:
It is a cross-functional Planning process designed to keep demand and supply in balance. This is achieved by continually monitoring external market demand changes (through the Sales department) and communicating these changes to the internal organization. Personnel in the Supply Chain, Finance and Production departments utilize this information to optimize purchasing (Inventory) and production (Operations) planning decisions. Dr. Muddassir Ahmed, Ph.D, SCM Dojo
S&OP is the result of monthly planning activities. It is usually based on an Annual Operations Plan (AOP) that acts as the company’s annual target in terms of sales and supply. Therefore, the sales and operations plans are a means to gradually accomplish the AOP targets – by linking monthly sales and marketing planning directly to the operations side of a business. Wikipedia, The Free Encyclopedia
At Java Furniture Company they use a rolling 60 day planning cycle to accommodate the long transit times for products that are shipped to and from Indonesia. S&OP provides a framework to guide people from different areas of the company as they work together to forecast overall product demand and create a demand plan that apportions this demand across facilities in the supply chain. Then people create a supply plan for the company that shows how products will be procured, produced and delivered to meet demand at the facilities.
The basic S&OP process is illustrated in the figure below. Simulations are used to reconcile the Supply Plan with the Demand Plan. Simulations find where the supply plan does not align with the demand plan, and helps people address discrepancies between the two plans. People follow the five-step process shown in the diagram below.

Data from the Demand Plan is used to define the products and facilities in the company’s supply chain model. And data from the Supply Plan is used to define production rates at factories plus vehicles and delivery routes in the model. Running simulations then finds the mismatches between the demand and supply plans and provides data to evaluate ways to fix those problems. Simulations let people try out different ideas and quickly see how well they work and what the related costs are.
See more about how Java Furniture company uses S&OP in the short video below. The SlideShare presentation below that, “Sales and Operations Planning (S&OP) with Supply Chain Simulations,” summarizes information presented in the video. You can download a PDF copy of the presentation for a concise example showing how to combine supply chain simulations and S&OP to create an on-going process of supply chain planning and adjustment.

You can download a short SlideShare presentation that documents the five-step S&OP process shown in the video:

FIRST CHALLENGE — Implement the changes to the AS IS supply chain described above
Use the demand and production numbers shown for the furniture factories, and increase the numbers by 20 and 40 percent as described above. Also increase demand appropriately to represent increased sales at the various stores and warehouses that products are delivered to. Do whatever you feel you need to do to get the resulting supply chain to run for 60 days.
[ Note: When you have questions about working with this case, the answer is to ask, “What would I do if this were the real world and I was the person in charge?” First read the rest of this introduction, and import a copy of the Java Furniture Company supply chain from the library. Then run some simulations. Simulations and the resulting P&L reports will show how the supply chain works and where improvements are needed. Add/change/delete products, facilities, vehicles, and routes to make improvements and achieve the supply chain performance you want. Model different ideas; simulations show how well they work. Pick what works best. ]
Make a short report of findings that describes what you did to make the supply chain run for 60 days and support the increased sales targets. Use screenshots and simulation data to illustrate your report. Note the areas of greatest cost and facilities with most on-hand inventory and explain why that occurs. Note also where are the points of most risk in this supply chain. Suggest possible ways to manage cost, risks and inventory levels in this supply chain.
Here are some things to think about as you work through this first challenge:
- Assume you continue using the current transportation model of trucks and ocean shipping, Assume any size of truck from large to small can use the main coast highway between the factories and the Port of Semarang (change the existing model to eliminate the detour route used by large and medium trucks moving between the factories and the port).
- Identify the points of greatest risk in the supply chain. Points of risk are facilities, vehicles and/or routes where a disruption in operations would affect the largest number of other facilities in the supply chain. You will often find these risk points because they are facilities where products either run out or require too much storage space.
- Performance trends you see in simulations of the first 30 days will largely predict performance for the next 30 days. Focus first on getting the supply chain to run for 30 days and then it will be easier to extend its performance for 60 days.
- When you look at the simulation results, look for the large numbers and the overall trends. Which facilities generate the biggest costs and why? What can be done about them?
- You will need to use some advanced modeling techniques, so make sure to read the online guide section “Tips for Building Supply Chain Models“.
- The Java Supply Chain model comes with some default values originally estimated in 2016. You may want to do a bit of research to update default values to make them more current. The logic of the model and simulation remains the same, but different numbers used to define the entities in the model will give different answers in the simulation — see more about this in the Footnotes section at the bottom of this page.
This is an ADVANCED LEVEL case study – work through a beginning level case such as Cincinnati Seasonings before attempting to work on this case.
SAVE BACKUP COPIES of your supply chain model from time to time as you make changes. There is no “undo”, but if a change doesn’t work out, you can restore from a saved copy. And sometimes supply chain model files (json files) become damaged and no longer work, so you want backup copies of your supply chain to restore from when that happens.
NOTE: An earlier bug that displayed some routes times and distances as ONE-WAY has been fixed. All routes now show ROUND-TRIP times and distances. Simulations use ROUND-TRIP times and distances.
REPORTING TEMPLATE for use with this case study: Import your simulation data into the template and create monthly profit & loss reports as well as generate key performance indicators. The reporting template is set up for the S&J Trading Company, but look at how the reports read the simulation data and you will see how to change the spreadsheet to add more products and facilities to accommodate this case study – Download copy of Multi-Product P&L Reporting Template here
[If you are using SCM Globe Professional version, these reports can be generated automatically by clicking on the “Generate P&L Report” button on the Simulate Screen]
To share your changes and improvements to this model (json file) with other SCM Globe users see “Download and Share Supply Chain Models”
PART 2 — The “TO BE” Supply Chain
PART 2 of this case uses simulations to explore different ideas and design a supply chain to support company growth (the TO BE supply chain). Simulations are also used to evaluate supply chain designs from the perspectives of resiliency, risk management, and carbon footprint.
By the end of the first round of meetings in Brussels, your supply chain model and simulations have achieved that critical first objective. Everybody on the task force has acquired a common understanding of their company’s supply chain and how it works. People are starting to understand how different parts of the supply chain work together, and appreciate the costs and trade-offs involved in creating an expanded supply chain to support the company’s sales growth.
In the days ahead members of the task force will return to their respective offices, and you will guide them through a process of exploring options and creating new supply chain designs. After meeting in person, members of the task force continue their collaboration online. People can model their ideas and run simulations to see for themselves what happens. They can explore relationships and trade-offs between the four supply chain entities that make up the model – products, facilities, vehicles and routes.
When people on the task force come up with interesting new designs, they send around copies of their supply chain models for others to review and run for themselves. In this process several models evolve. They embody the most promising supply chain designs. The designs continue to get better as people review them and add their own ideas and changes to the models.
Expected and Unexpected Disruptions Raise Questions
As the project progresses, people on the task force discuss how traffic is becoming ever more congested in the city of Semarang and on the access roads leading to the port. This congestion is restricting the number of daily trips trucks can make between the factory and the port. People expect the port of Semarang will become a bottleneck in the company’s supply chain as production volumes increase.
Then unexpectedly, a bridge on the main coast highway linking the port and the factory is partially closed for repairs. Where there were once two eastbound lanes and two westbound lanes, there is presently only one lane available for traffic going in each direction. Large and medium trucks have been banned entirely. Only small trucks can use the bridge now, and other trucks have to take a different route. The supply chain needs to be redesigned.
In the model of the existing company supply chain you make the changes called for by this event. You create new routes for the large and medium trucks that were using the coast highway. The new detour route adds about two hours and another 125 km distance to each round trip. The simulation shows how these new expenses will add up, and how the flow of inventory will be affected.
The screenshot below shows the bridge where the lanes are closed for repair (red arrow). It is not clear how long this repair work will take. It may well require a year or more to complete. What other transportation options are available?

Note that in the screenshot there are two railroad bridges just below the highway bridges. You can see this by zooming in on the point where the main coast highway crosses a river just west of the city of Pekalongan in Central Java (type “Pekalongan” into the search location box in the upper left corner of the screen). What if it were possible to use rail transport to move products back and forth between the factory and the port? This generates a lot of discussion between task force members.
Evaluating Other Transportation Options
It turns out rail service is available. However, at present it is slow and unreliable due to lack of maintenance on infrastructure and rolling stock. But the Indonesian government is considering upgrades to this railroad infrastructure to keep the country competitive with other nations in the region.
You send around links to a couple of relevant presentations about the Indonesian transportation network (additional web searches will yield more information):
- Development of Freight Transport Options for Sustainability in Indonesia – Dr. Elly Sinaga, Deputy Director General, Research and Development, Ministry of Transportation; Republic of Indonesia — See document here
- Modal Competition for Freight in Land Transportation on Jakarta-Surabaya Corridor — Lita Sari Barusa, Sigit Pranowo Hadiwardoyoa, Hipolito Martell-Floresb, Jean-Louis Batozb, Department of Civil Engineering, Faculty of Engineering, University of Indonesia, and Department of Urban System Engineering, University of Technology of Compiegne — See document here
There is also potential for sea-going barge service between the factory and the Semarang Port. Zoom in and look more closely at the main factory. Switch to the satellite view and look around. What do you see on the coast nearby? Do the economics of using barges to transport products between the factories and the port look attractive?
If the Semarang port is reaching capacity, what about shipping out of Surabaya on the eastern end of the island, or out of Jakarta on the west end? What is the effect of these options on transportation costs and on-hand inventory levels at different facilities?
What if the rail road service were upgraded and it became dependable and ran every other day between the factory and the ports of Jakarta, Semarang and Surabaya? Transport by rail on routes of 100 km or more costs about one fifth the cost of using trucks. And transport by coastal barge or small freighter is about one tenth the cost of trucks. You ask people for ideas they may have on combining rail and/or ship transport with trucks to create a better supply chain. The map below shows the Java transportation network.

Transportation Modes have Big Impact on Cost and Carbon Footprint
Java Furniture wants to manage its transportation costs and also manage its carbon footprint. Supply chains generate a lot of carbon as they move products from one place to another. Trucks and airplanes are the two most carbon intensive modes of transportation. Investigate options for using railroad and ships instead of trucks to move products on the island of Java. Carbon generation numbers are always changing as technology changes, so do a little research and see what you can find. Here are some basic estimates you can use to get started (these numbers are already entered as default values when you create new vehicles):
- Large Diesel Truck (110 m3) – 0.9 kg carbon per km
- Medium Truck (60 m3) – 0.7 kg carbon per km
- Small Truck (40 m3) – 0.5 kg carbon per km
- Train 40 ft freight container (65 m3) – 0.1 kg carbon per km
- Ship 40 ft freight container (65 m3) – 0.02 kg carbon per km
- Jet Airplane freight container (6 m3) – 1.2 kg carbon per km
Do some web searches and look for freight forwarding and logistics companies that do business in Indonesia. See what you can learn from their websites about transport options and costs for different modes of transportation. Do searches on relevant phrases such as “transportation services in Indonesia” , or “3PL companies in Indonesia”, etc. Here’s one such company and you can find others – https://www.apllogistics.com/solution/transportation
If you switch to rail or coastal barges for part of the supply chain how would that affect overall carbon footprint of the supply chain? How would it affect transportation costs? Would it be cost effective to import and export through Surabaya or Jakarta as well as Semarang? Make your best guesses about transport costs and carbon footprints based on your research. Build supply chain models and run simulations to explore possibilities in these areas.
Managing Supply Chain Risk and Resilience
The production level for teak lumber produced in Indonesia is fixed because that is the level that sustainable harvesting of trees will support. So the company needs to find supplies elsewhere to enable increased furniture production. But costs will go up because of transportation cost involved in importing wood from overseas sources such as Africa, North America and South America.
Considerations of supply chain resiliency are becoming ever more important. The potential bottleneck at Semarang port will only become more critical as more teak and other exotic wood from overseas is imported for furniture production. And, of course, more furniture will also be exported back through the port to customers. Stoppages or delays at this one port will quickly ripple through the entire supply chain, and could bring the company’s global supply chain to a halt.
You guide the task force in discussions about what they see as the biggest supply chain and business continuity risks, and you add your own insights. Then you facilitate discussions on ways to deal with these risks. You model some of the best ideas and see how well they work by running simulations (see more on balancing supply chain risk and performance).

[ This risk assessment and contingency planning process is explored in more detail in an interesting article at SupplyChainDrive.com – “Supply chain resilience plans start with mapping — but don’t wait for disruption to test them“]
For instance, a good way to respond to the risk of bottlenecks at Semarang is to also ship through one or two other ports. So you create a supply chain model that has shipping facilities in Surabaya and Jakarta (are there other ports with adequate facilities on the island?). You run simulations and try various mixes of trucks and railroad and barge transportation and see what happens to overall costs and inventory levels.
You also explore supply chain risks associated with other issues. What if actual demand is even higher than the marketing people currently project? Will the supply chain be able to support that increased business? And what if one or more suppliers were to stop supplying raw material? Where would inventory shortages develop? How much safety stock should you hold in reserve to guard against such events? You make model adjustments and run simulations to explore how best to respond to those events.
Recommended Supply Chain Improvements – the New Supply Chain
During the project you and others on the task force create several models of possible supply chains to support company growth. Task force members examine these models, make adjustments, and run simulations. Good ideas from all the models are combined into a final proposed supply chain model and presented along with task force recommendations to company senior management. The task force members once again convene in person at company headquarters for the presentation of the recommended new supply chain design.
With company senior executives sitting around the boardroom table, you project the current and proposed supply chain models up on the big screen at the front of the room. You employ many of the same techniques you used when you showed your initial supply chain model to the task force members at the beginning of this project. Simulations are run to show how the current supply chain operates, and to show how the proposed new supply chain will support company growth. You combine simulation data with satellite views of actual facilities and routes to clarify the recommendations and answer questions. Individual members of the task force step up to provide more information about recommendations in their particular areas of expertise.
By the end of the presentation people are smiling and nodding their heads. The “To Be” supply chain design and the task force recommendations are well received. Everyone (even senior management 🙂 ) can understand what is involved. And all can see how they and the company will benefit. They ask you and your firm to stay on the project and help with implementation.
SECOND CHALLENGE — Design a “TO BE” supply chain to support company growth and manage risk
Show how you will use a mix of truck, railroad, barge and ocean shipping to move the increased flow of products while also managing and reducing transportation costs. Show how you will schedule production at the factories to meet product demand at the stores and warehouses while also minimizing the cost and amount of on-hand inventory across the supply chain. Also identify the most critical supply chain risks and explain how your supply chain design will manage these risks.
[ For questions about working with this case the answer is always to ask, “What would I do if this were the real world and I was the person in charge?” Model and simulate different ideas. Make plausible assumptions, then add/change/delete products, facilities, vehicles and routes as called for to model your ideas. Simulations show how well they work. Pick the best ones. ]
The port at Semarang is clearly a potential bottleneck and a significant risk because any slow-down or stoppage there would quickly be felt across the entire supply chain. Expand the existing supply chain model to enable shipping from at least one other port on the island of Java. Change some of the shipping routes that currently depart from Semarang to depart instead from other port(s) you decide to include in your new supply chain design. Simulate your new design and make improvements to your new “To Be” supply chain.
Make a live presentation using your “To Be” supply chain model to illustrate your recommendations. Accompany your model and simulation with a set of presentation slides containing your recommendations. Use screenshots and simulation data to illustrate your recommendations.
Explain how your “To Be” supply chain handles the flow of inventory needed to support sales growth, and how it manages cost and risk in the supply chain, all at a competitive cost. It is this combination of product flow, risk management, and competitive operating cost that makes a winning supply chain.
Here are some things to think about as you work through this second challenge:
- Assume large and medium trucks can no longer use the main coast highway between the factories and the port at Semarang (the Java Furniture supply chain model in the SCM Globe library has this assumption already built in as large and medium trucks use a detour route to move between the factories and the port).
- Do some research on different transportation options in Indonesia and their respective costs. Use the links provided above for relevant information and do your own Internet searches to see what you can find. Do the best you can with the time you have available to perform this research. As the saying goes, “Good is good enough.” Do your research, document your sources, make your best estimates, and move on.
- Once you have researched information for vehicles, routes and operating costs, develop at least two separate supply chain models that explore different mixes of transportation modes (truck, railroad, barge, ocean shipping). Select the model that delivers the best results.
- Explore options for lowering on-hand inventory and facility storage costs. Find ways to adjust delivery schedules and delivery amounts at each facility so as to smooth out the on-hand inventory levels and keep them as low as possible without running out. Then reduce storage capacity at facilities where you can to reduce operating costs.
- Find useful ideas for reducing inventory and for calculating optimum product delivery amounts and schedules by reading “Cutting Inventory and Operating Costs” in the online guide.
- Balance need to reduce on-hand inventory and facility operating costs with need to keep adequate safety stock inventory at various facilities as a hedge against missed deliveries of products
- You can measure the carbon footprint of different supply chain designs if you enter estimates for carbon generation for the facilities and vehicles in the supply chain. What can you do to lower the carbon footprint of your supply chain?
- Describe the trade-offs you made between managing risk, and managing costs and carbon footprint in your supply chain design. You cannot afford to manage all possible risks, nor can you always use vehicles and facilities with the lowest carbon footprint. You must manage the most critical risks and make operating decisions to best manage carbon footprint. You have to find the right balance between cost, carbon, and risk.
NOTE: This is an ADVANCED LEVEL case study – work through a beginning level case such as Cincinnati Seasonings before attempting to work with this case.
REPORTING TEMPLATE for use with this case study: Import your simulation data into the template and create monthly profit & loss reports as well as generate key performance indicators. The reporting template is set up for the S&J Trading Company, but look at how the reports read the simulation data and you will see how to change the spreadsheet to add more products and facilities to accommodate this case study – Download copy of Multi-Product P&L Reporting Template here
[If you are using SCM Globe Professional version, these reports can be generated automatically by clicking on the “Generate P&L Report” button on the Simulate Screen]
SAVE BACKUP COPIES of your supply chain model from time to time as you make changes. Click “Save” button next to your model in Account Management screen. There is no “undo”, but if a change doesn’t work out, you can restore from a saved copy. And sometimes supply chain model files (json files) become damaged and they no longer work, so you want backup copies of your supply chain to restore from when that happens.
SHARE CHANGES AND IMPROVEMENTS to this model (.json file) with other SCM Globe users see “Download and Share Supply Chain Models”
Footnotes:
Several advanced techniques were used to build this supply chain model. These techniques are explained below (see more modeling tips and techniques in the online guide at Tips for Building Supply Chain Models) :
- Combined Facilities –The model uses three central facilities in Java to represent multiple locations where teak wood is harvested. Teak trees are selectively cut in many small locations within a 50 kilometer radius of the three central facilities; sometimes trucks pick up teak wood at individual cutting sites and sometimes they pick up the wood at these central facilities. There is no need to put all the detail of the multiple harvesting locations in this overall supply chain model (you can build another more detailed model of these logging operations later if that is needed).
- Product Categories – The company has about 200 different furniture items, and purchases many kinds of lumber and hardware fixtures, so this model groups these products into categories to manage complexity. For example, there are three categories or lines of furniture – A, B, and C. You calculated average volume, weight and cost numbers for a typical item in these three product categories. This models the flow of products through the supply chain well enough without overwhelming people with detail that would confuse and obscure a big picture understanding of the whole supply chain.
- Standard Shipping Containers – The company sends products to customers and receives products from suppliers in shipping container quantities. So to model the shipping of finished products to overseas customers and the importing of raw material and component parts from overseas suppliers, you define vehicles as multiples of 40 foot high capacity shipping containers (40’ HC) and 20 foot standard capacity containers (20’ Stnd). These containers can hold a mix of products.
- Weekly Delivery Schedules – With these shipping container vehicles you use a special technique to model the delivery schedules. Because the routes these shipping containers travel have travel times of two to three weeks at average ship speeds (about 30 km/hr), and because you want to show shipments being made and received every week or every other week, you increase the speed of these vehicles so the round trip time is reduced to one week or two weeks, and you set the delay between departures for these vehicles to be zero. Now your model accurately records a stream of shipments leaving and arriving each week.
- One-Way Shipping Costs – You also set the vehicle operating cost to be one half the normal cost. This models the use of one-way shipping containers to move products from one port to another on a regular schedule without worrying about when a particular container (vehicle) returns to its port of origin. You also cut the estimated carbon footprint for the vehicle by half for the same reason.
- Supply Chain Boundaries – The company owns and operates two stores in Indonesia’s capital city, Jakarta, so you include them in the model. Otherwise, the company operates or leases warehouse space in cities in Asia and Europe where the furniture is sold at wholesale to local retail outlets. So you do not include all the stores worldwide that sell the company’s furniture. The supply chain model just shows the warehouses. Demand is placed on those warehouses to represent sales to the stores those warehouses support. Two of the warehouses are also shown as producing hardware to represent hardware they purchase from outside suppliers. You show the suppliers of furniture wood used by the company, but you zeroed out the cost and carbon footprint data for those facilities because they are not owned or operated by the company.
Operating Costs and Performance Capabilities Change All the Time
The models in the SCM Globe library come with default values based on research and estimates done at certain points in time. You can use the default values, or you can research any of the default values and enter more current numbers into your model. In the Edit screen select an entity you want to update (product, facility, vehicle, or route). Type over old numbers with new numbers that you find to be more current and accurate. Cite your data sources and estimating techniques for these new numbers when you present your simulation results.
Here is a good example of such research yielding better estimates for storage costs at Semarang Port and other facilities in this supply chain (comment came from a master’s student at Georgia College & State University, J. Whitney Bunting College of Business):
“Just wanted to give you a heads up on some changes we are making to our model… I did a quick analysis of the facility storage cost for our first run on the 60 days for a single facility, the Semarang Port.
Storage Cost Analysis Semarang Port Storage
Daily Rent Cost M3 $ 2.10
Daily Operating Cost $ –
Units Received 1,400
60 Day Cost – Keep it Running $ 2,520,000
Storage & Handling Cost Per Unit (2 Months) $ 1,800
“The total units received at this facility totaled 1,400 units for the two month period, yet the facility charge was $2,520,000, or $1,800 for every unit received.
“I then did a conversion comparing a standard 48 X 40 Pallet 5 foot high, with an average in and out storage handling charge per month of $12 which is a baseline rate. There are many variances in the actual rates depending on whether the product is racked or if it’s just floor loaded (eats up more cubic volume), but I think the $12 is in the ball park for a racked rate (which you would expect for these size units).
“If you use that $12 rate for a standard sized pallet and convert that rate to cubic meters, and assuming an average size unit of 1.5 Cubic Meters (Furniture B is 1.5 Cubic Meter versus 1 Cubic Meter for A and 2 Cubic Meters for C) you arrive at a daily storage rate of $0.16 per cubic meter versus the $2.10 in the original model.
“For this facility we adjusted the daily rate to $0.16, and will make similar adjustments to the other facilities. For sites with storage that don’t have a daily storage charge, we will use an estimated storage charge.
[ We totally agree — and used this research to update facility storage costs in the model – 24 Feb 17 ]
REPORTING TEMPLATE for use with this case study: Import your simulation data into the template and create monthly profit & loss reports as well as generate key performance indicators. The reporting template is set up for the S&J Trading Company, but look at how the reports read the simulation data and you will see how to change the spreadsheet to add more products and facilities to accommodate this case study – Download copy of Multi-Product P&L Reporting Template here
[If you are using SCM Globe Professional version, these reports can be generated automatically by clicking on the “Generate P&L Report” button on the Simulate Screen]
To share your changes and improvements to this model (json file) with other SCM Globe users see “Download and Share Supply Chain Models”
Register on SCM Globe to gain access to this and other supply chain simulations. Click the blue “Register” button on the app login page, and buy an account with a credit card (unless you already have an account). Scan the “Getting Started” section, and you are ready to start. Go to the SCM Globe library and click the “Import” button next to this or any other supply chain model.